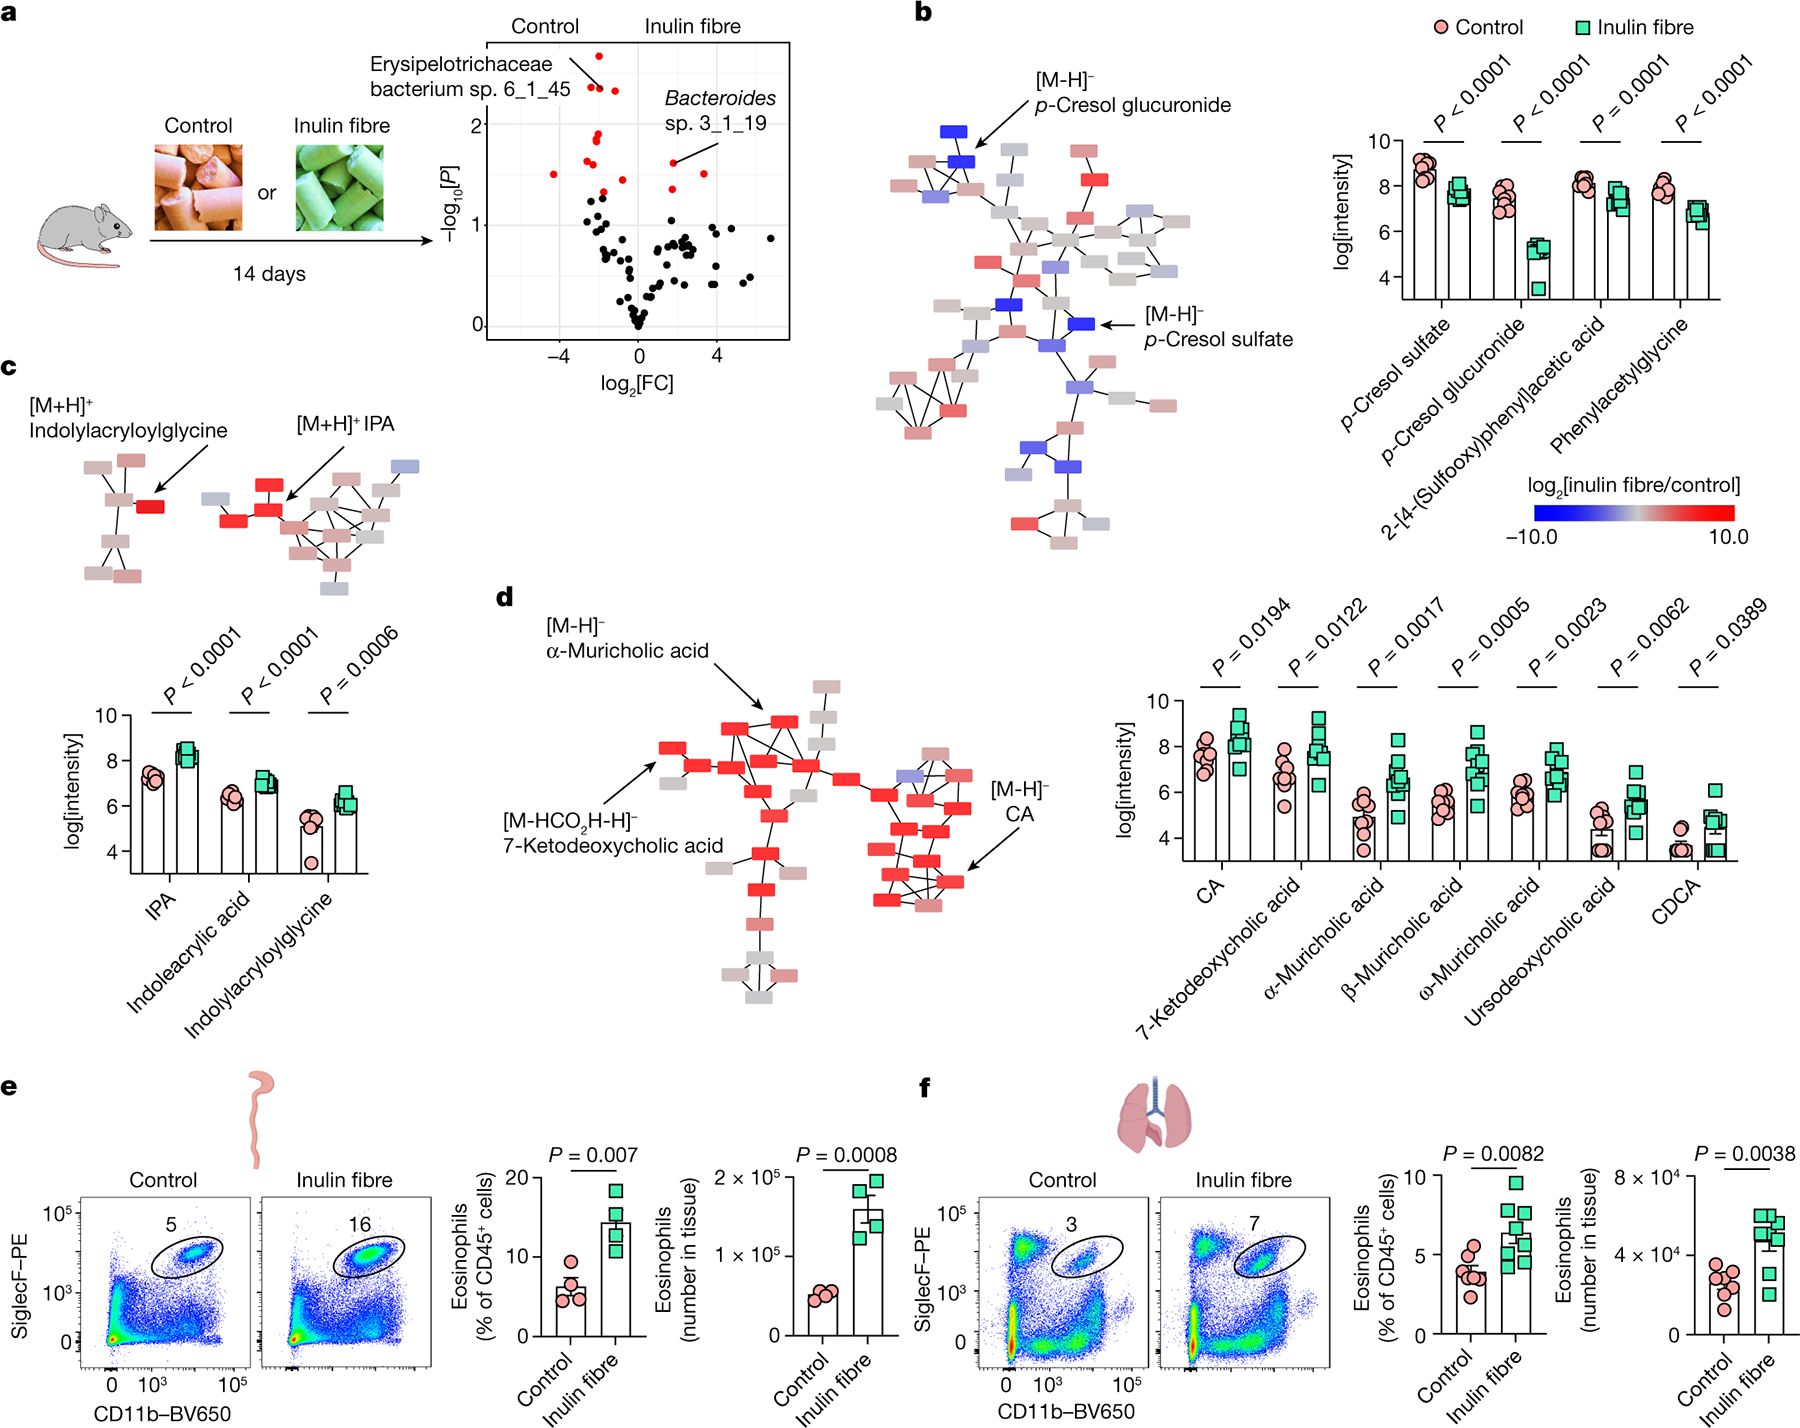
Fig. 1 |. Inulin fibre diet upregulates systemic bile acids and tissue eosinophils.

a, Schematic of the experimental design (left). Right, the differential abundance of intestinal microbiota in control versus inulin fibre diet groups mapped to the HMP database. n = 5 mice. The red dots show differentially abundant taxa (P < 0.05, determined using DESeq2 Wald test). FC, fold change. b–d, Partial representation of the MS2 network for mouse serum, highlighting three clusters for phenolics (b), indoles (c) and bile acids (d). n = 8 (control) and n = 9 (inulin fibre) mice. Each node represents a unique feature, and the connections between nodes indicate the similarity between MS2 spectra. Blue represents downregulated and red represents upregulated features in the inulin fibre group compared with the control group. The arrows indicate some of the differentially abundant compounds. The bar graphs show the relative abundance of metabolites that were significantly different between control and inulin fibre groups. Peak integration data from HPLC–MS analysis were log-transformed48 before statistical analysis. e,f, Representative flow cytometry plots, the frequency of CD11b+SiglecF+ eosinophils in the CD45+ population and the total number in the colonic lamina propria (n = 4 mice) (e) and the lungs (n = 7 (control) and n = 8 (inulin fibre) mice) (f). Data are representative of three independent experiments (a) or pooled from two independent experiments (b–d and f). For b–f, data are mean ± s.e.m. Statistical analysis was performed using unpaired two-tailed t-tests (b–f). The diagrams in a, e and f were created using BioRender.
