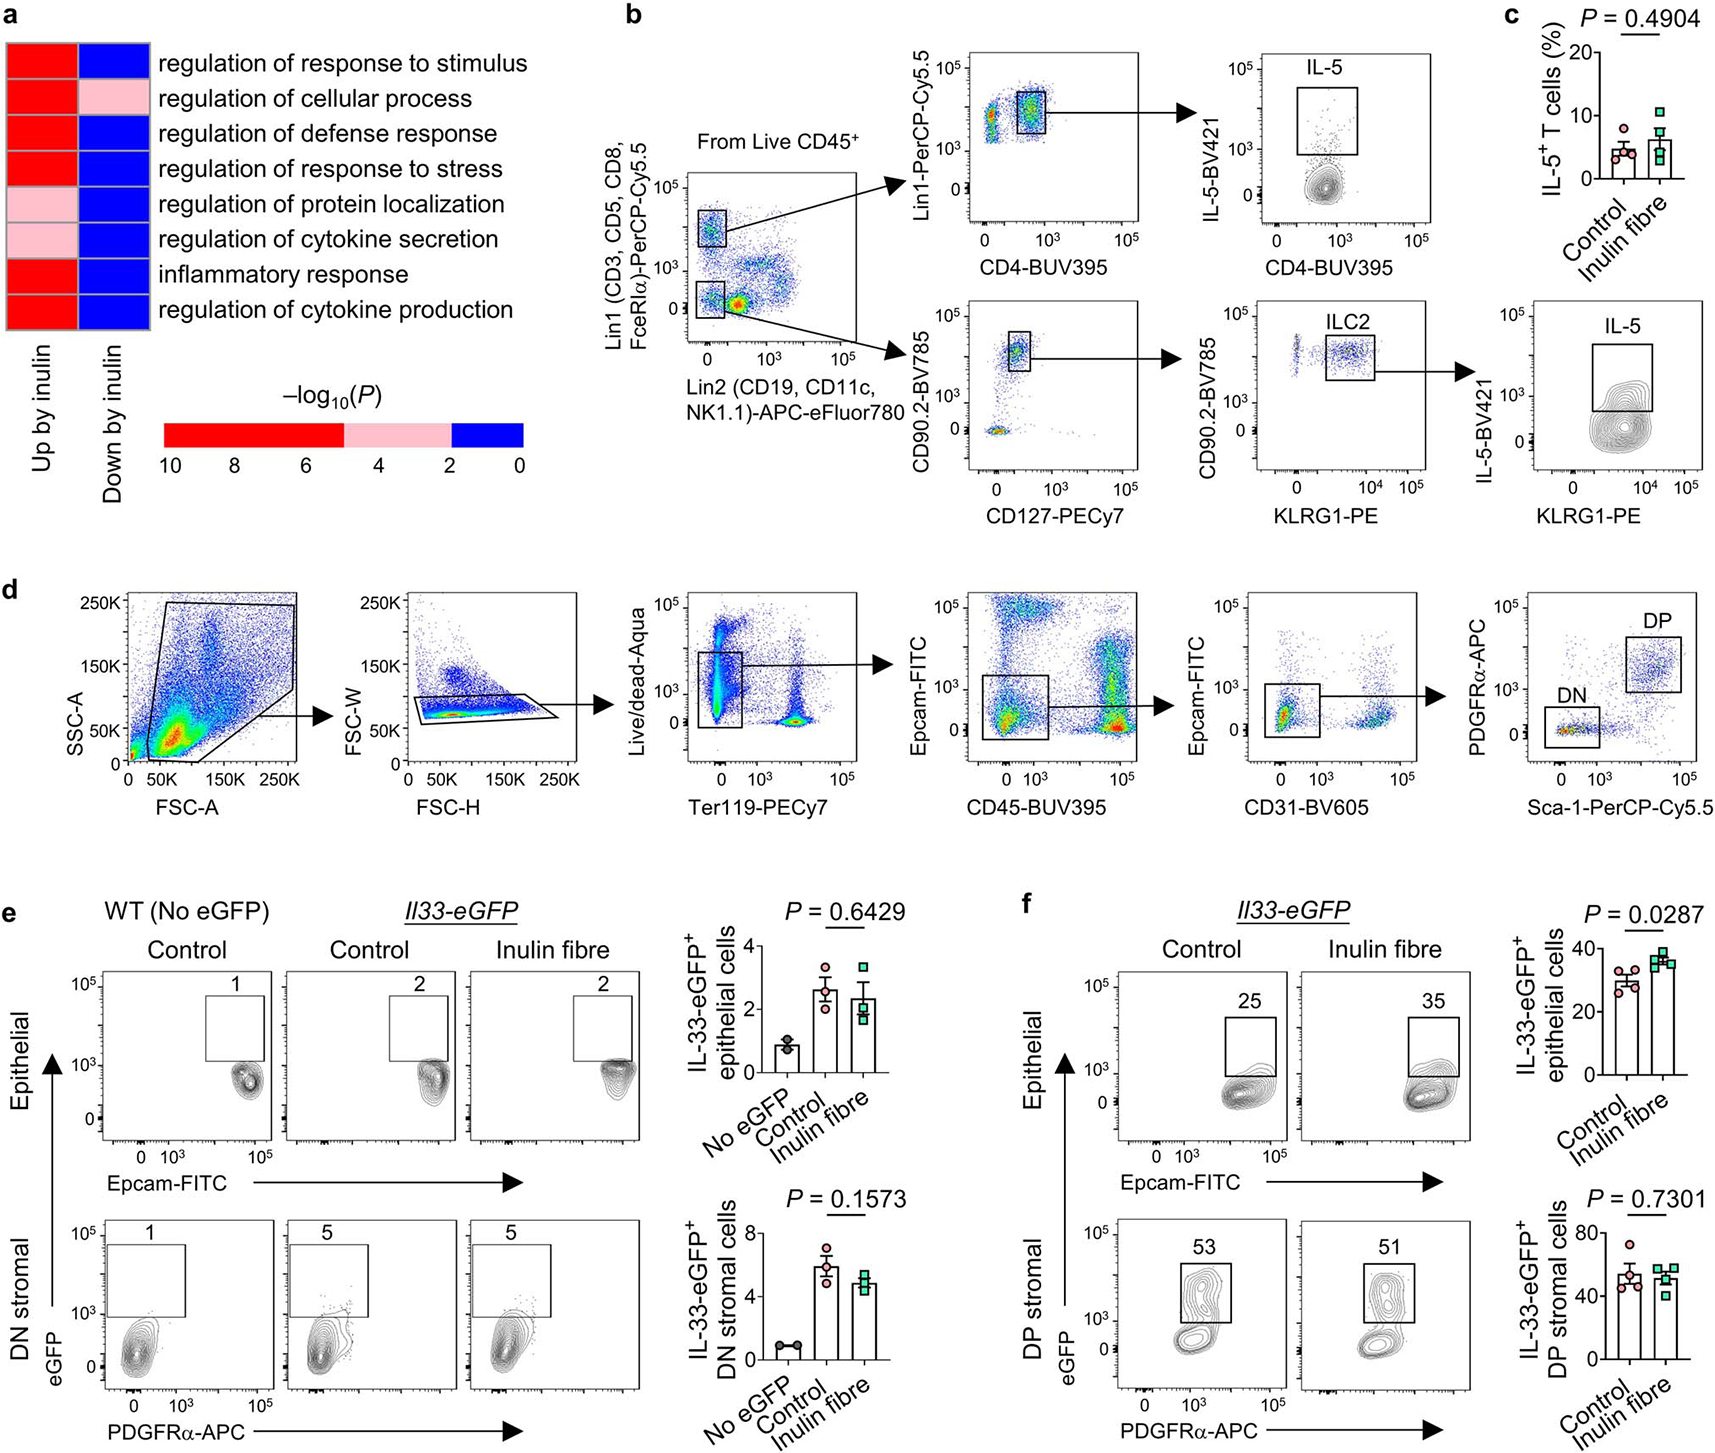
Extended Data Fig. 6 |. Inulin fibre diet-induced gene and protein expression in various immune and non-immune cells.

a, Mice were fed control or inulin fibre diet for two weeks and ILC2s (CD45+Lin−CD90.2+CD127+ KLRG1+) were sorted from colonic lamina propria cells. Heatmap showing level of significance of GO enrichment tests in the colonic ILC2 RNASeq data, as measured by −log10(Pcorrected). Blue, not significant (Pcorrected > 0.01), Red, significant (Pcorrected < 0.01). b,c Gating strategy for bar graphs for IL-5+ cells (including Fig. 2c) (b) and frequency of IL-5-expressing CD4+ T cells (c) in the colonic lamina propria of mice (n = 4 mice). d, Gating strategy for detecting PDGFRα+Sca-1+ (double positive, DP) mesenchymal stromal cells (for bar graphs including Fig. 2f) and double negative (DN) stromal cells in colon and lung tissues. e,f Flow cytometry plots and bar graphs showing IL-33-eGFP expression in epithelial and stromal cell subsets in the colon (e) and lung (f). n = 2 mice (No eGFP) or 3 mice (colon control or inulin fibre) or 4 mice (lung control or inulin fibre). Data in c,e,f, are representative of two independent experiments. Data are means ± s.e.m. Statistics were calculated by unpaired two-tailed t-test (c, f) or one-way ANOVA with Holm–Šidák’s multiple-comparisons test (e).
