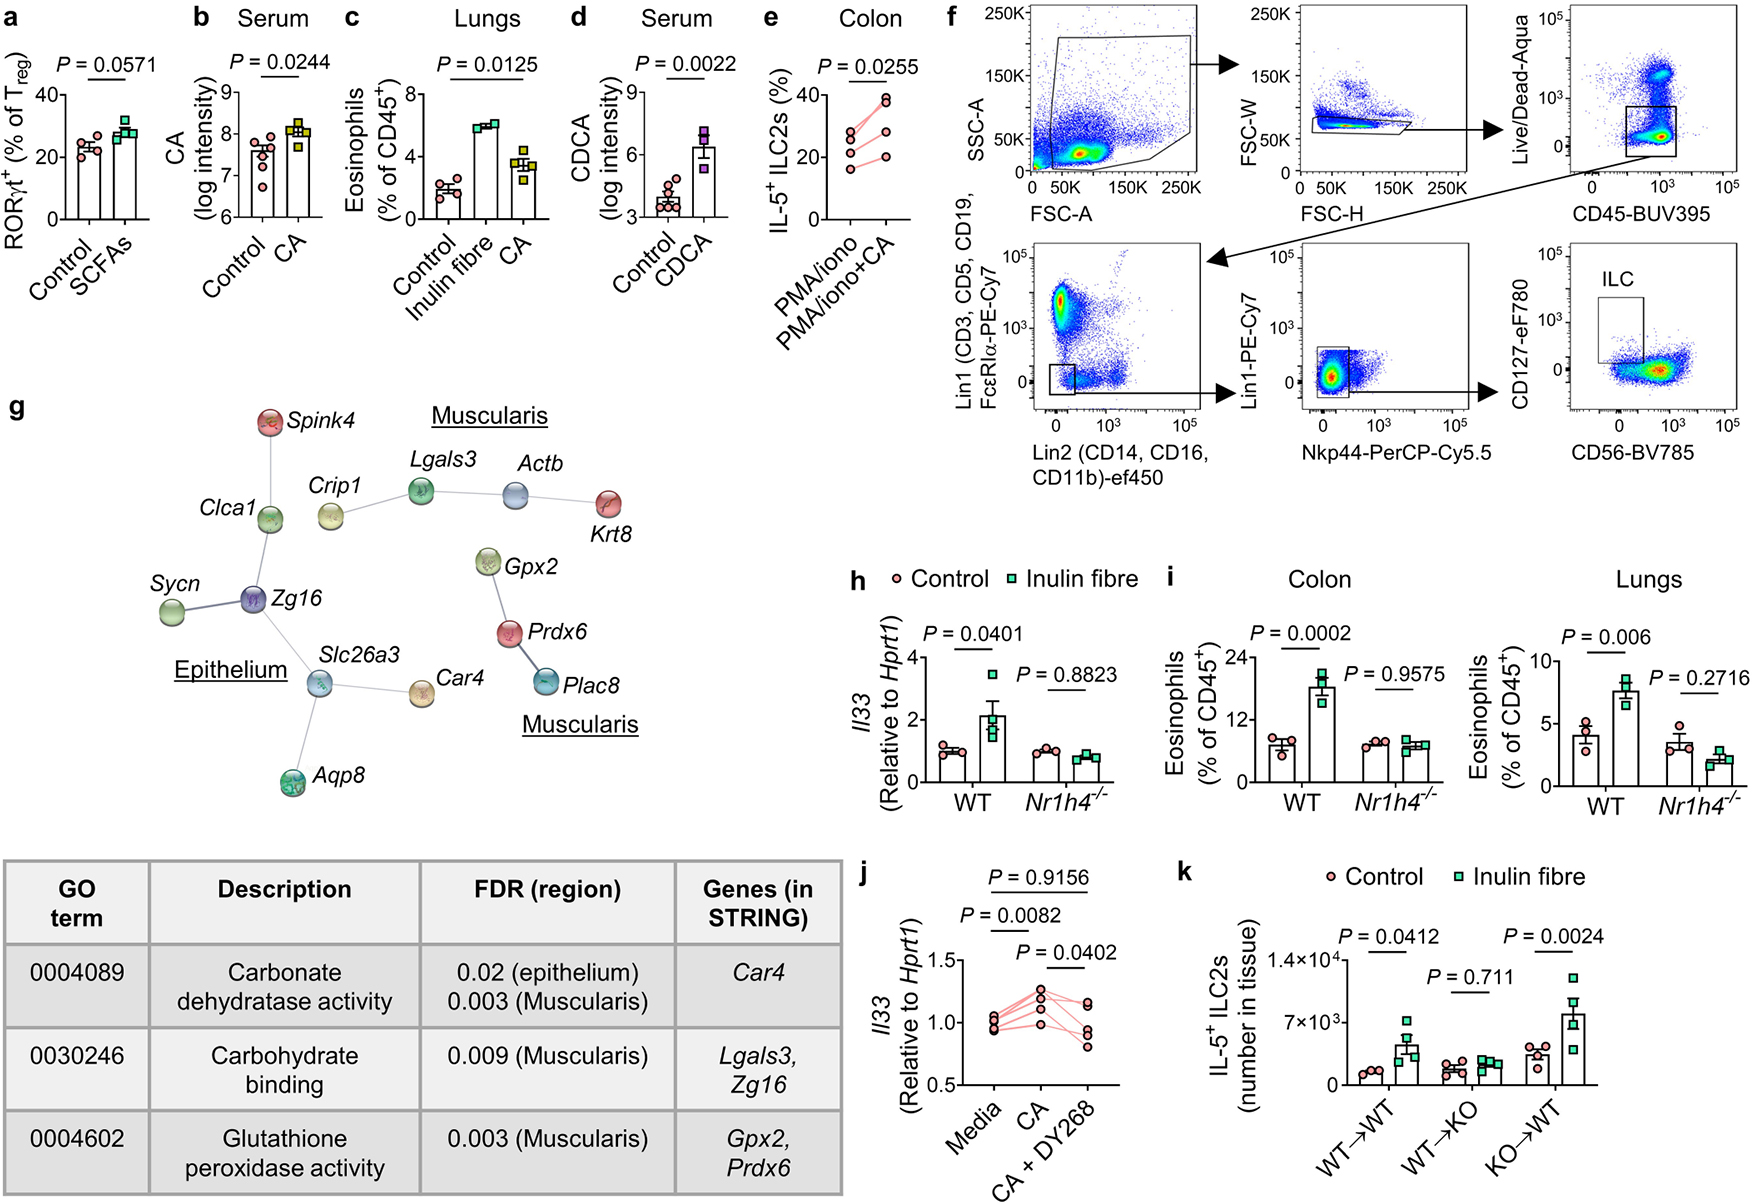
Extended Data Fig. 7 |. Effects of bile acid metabolites on immune and non-immune cells.

a, Frequency of RORγt+ subset of Tregs in the colons of mice administered SCFAs in drinking water, or water alone (control) (n = 4 mice). b, Serum levels of CA in mice provided with regular or CA-supplemented drinking water (control n = 6 mice, CA n = 4 mice). c, Frequency of eosinophils in the lungs of indicated groups (control n = 4 mice, inulin fibre n = 2 mice, CA n = 4 mice). d, Serum levels of CDCA in mice administered 6 mM CDCA in drinking water for two weeks (control n = 6 mice, CDCA n = 3 mice). e, Percentage of IL-5+ ILC2s in single cells from the colons of naïve WT mice in vitro stimulation with or without 50 μM CA (n = 4 mice). f, Gating strategy for detection of human ILCs (for bar graphs including Fig. 3f). g, Top, STRING network visualization of the genes upregulated by the inulin fibre diet (FDR < 10%) in the indicated layers of mouse colon determined by spatial transcriptomic analyses as shown in Fig. 3h. Lines represent protein–protein associations. Connected clusters of less than 3 nodes (genes), as well as all disconnected nodes were excluded. Bottom, a table shows selected significantly enriched KEGG pathways for the genes shown in the STRING network. h, Il33 expression in WT or Nr1h4−/− mice fed control or inulin fibre diet for two weeks (n = 4 mice for WT inulin fibre group and 3 mice for other groups). i, Frequency of eosinophils in the colons and lungs of WT and Nr1h4−/− mice on control or inulin fibre diet (n = 3 mice). j, Il33 levels determined by qRT-PCR in sorted stromal cells cultured for 7 days followed by stimulation for 24 h with media control or 50 μM CA with or without 10 μM DY268 (n = 5 mice). k, Number of IL-5-expressing ILC2s in the colon of bone marrow chimeric mice on indicated diets (For WT→WT, n = 3 mice for control or 4 mice for inulin fibre, For WT→Nr1h4−/−(KO) or KO→WT, n = 4 mice). Data in a–e, h–k are representative of two independent experiments. Data are means ± s.e.m. Statistics were calculated by Mann–Whitney U-test (a), unpaired (b,d) or paired (e, j) two-tailed t-test or one-way (c) or two-way (h,i,k) ANOVA with Fisher’s LSD test.
