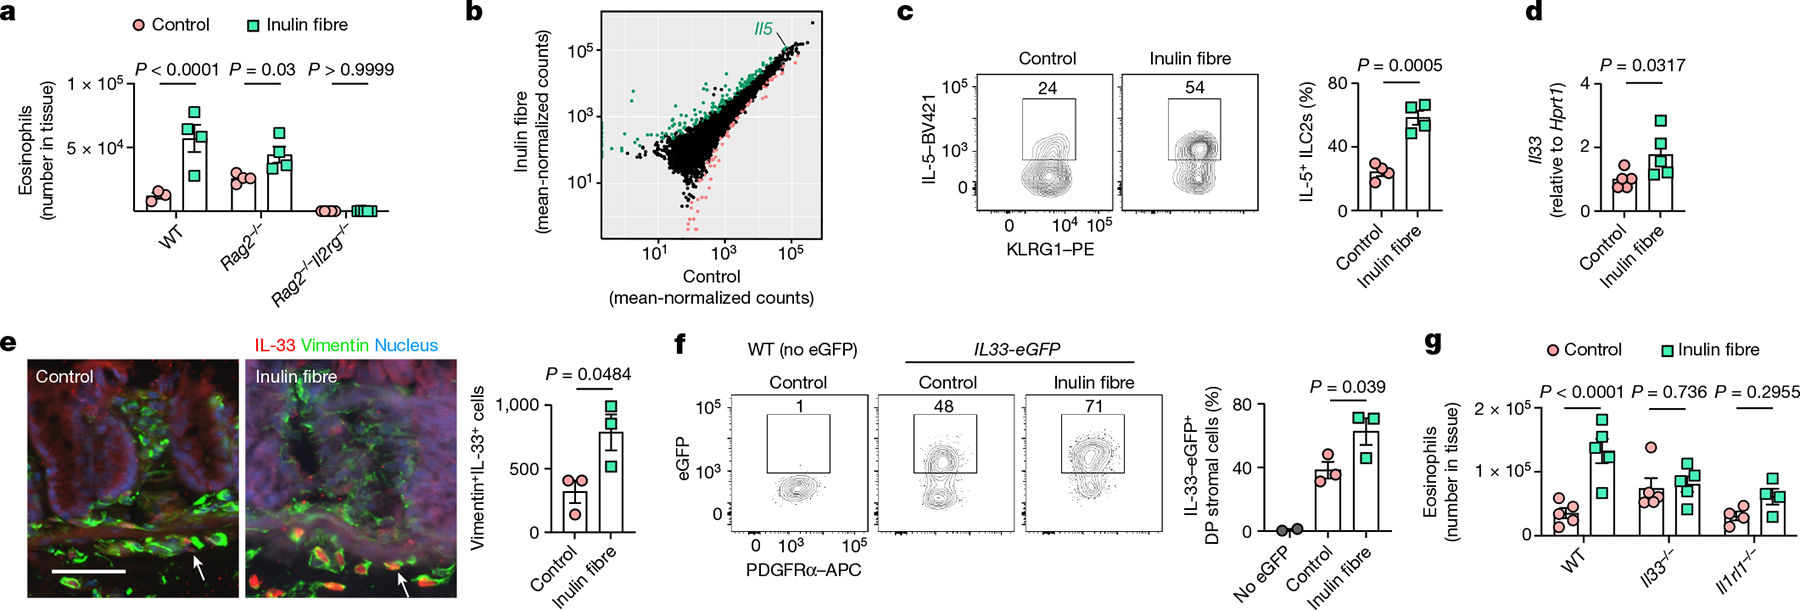
Fig. 2 |. Inulin fibre diet-induced eosinophilia requires ILC2s and IL-33.

a, The number of eosinophils in the colons of WT, Rag2−/− and Rag2−/−Il2rg−/− mice. n = 3 (WT control), n = 4 (WT inulin fibre or Rag2−/−) and n = 5 (Rag2−/−Il2rg−/−) mice. b, The differential gene expression of colonic ILC2s in mice fed the control or inulin fibre diet. Genes upregulated by inulin fibre diet are shown in green and genes downregulated by inulin fibre diet are shown in light red (DESeq2 Wald test, false-discovery rate (FDR) < 0.1). c, The frequency of IL-5-expressing KLRG1+ ILC2s in the colonic lamina propria, determined by intracellular cytokine staining. n = 4 mice. Flow cytometry plots were gated from CD45+Lin−CD90.2+CD127+ cells. d, Expression of Il33 in the distal colon determined by quantitative PCR with reverse transcription (RT–qPCR) analysis. n = 5 mice. e, Representative immunofluorescence staining showing IL-33 expression in vimentin+ stromal cells in the colons (n = 3 mice). The arrows indicate IL-33+ cells. Scale bar, 50 μm. The bar graph shows the quantification of IL-33+vimentin+ cells per cross-section of whole colon ‘Swiss rolls’. f, Flow cytometry plots and bar graphs showing IL-33-eGFP expression in PDGFRα+ Sca-1+ double-positive (DP) mesenchymal stromal cells in the colon. n = 2 (no eGFP) and n = 3 (control or inulin fibre) mice. g, The number of eosinophils in the colons of WT, Il33−/− and Il1rl1−/− mice fed the control or inulin fibre diet. n = 4 (Il1rl1−/−) and n = 5 mice (WT or Il33−/−) mice. Data are representative of two independent experiments (a and c–g). For a and c–g, data are mean ± s.e.m. Statistical analysis was performed using two-way (a and g) or one-way (f) analysis of variance (ANOVA) with Holm–Šidák’s multiple-comparisons test or unpaired two-tailed t-tests (c and e) or Mann–Whitney U-tests (d).
