
Extended Data Fig. 2 |. Changes in systemic metabolome by inulin fibre diet.
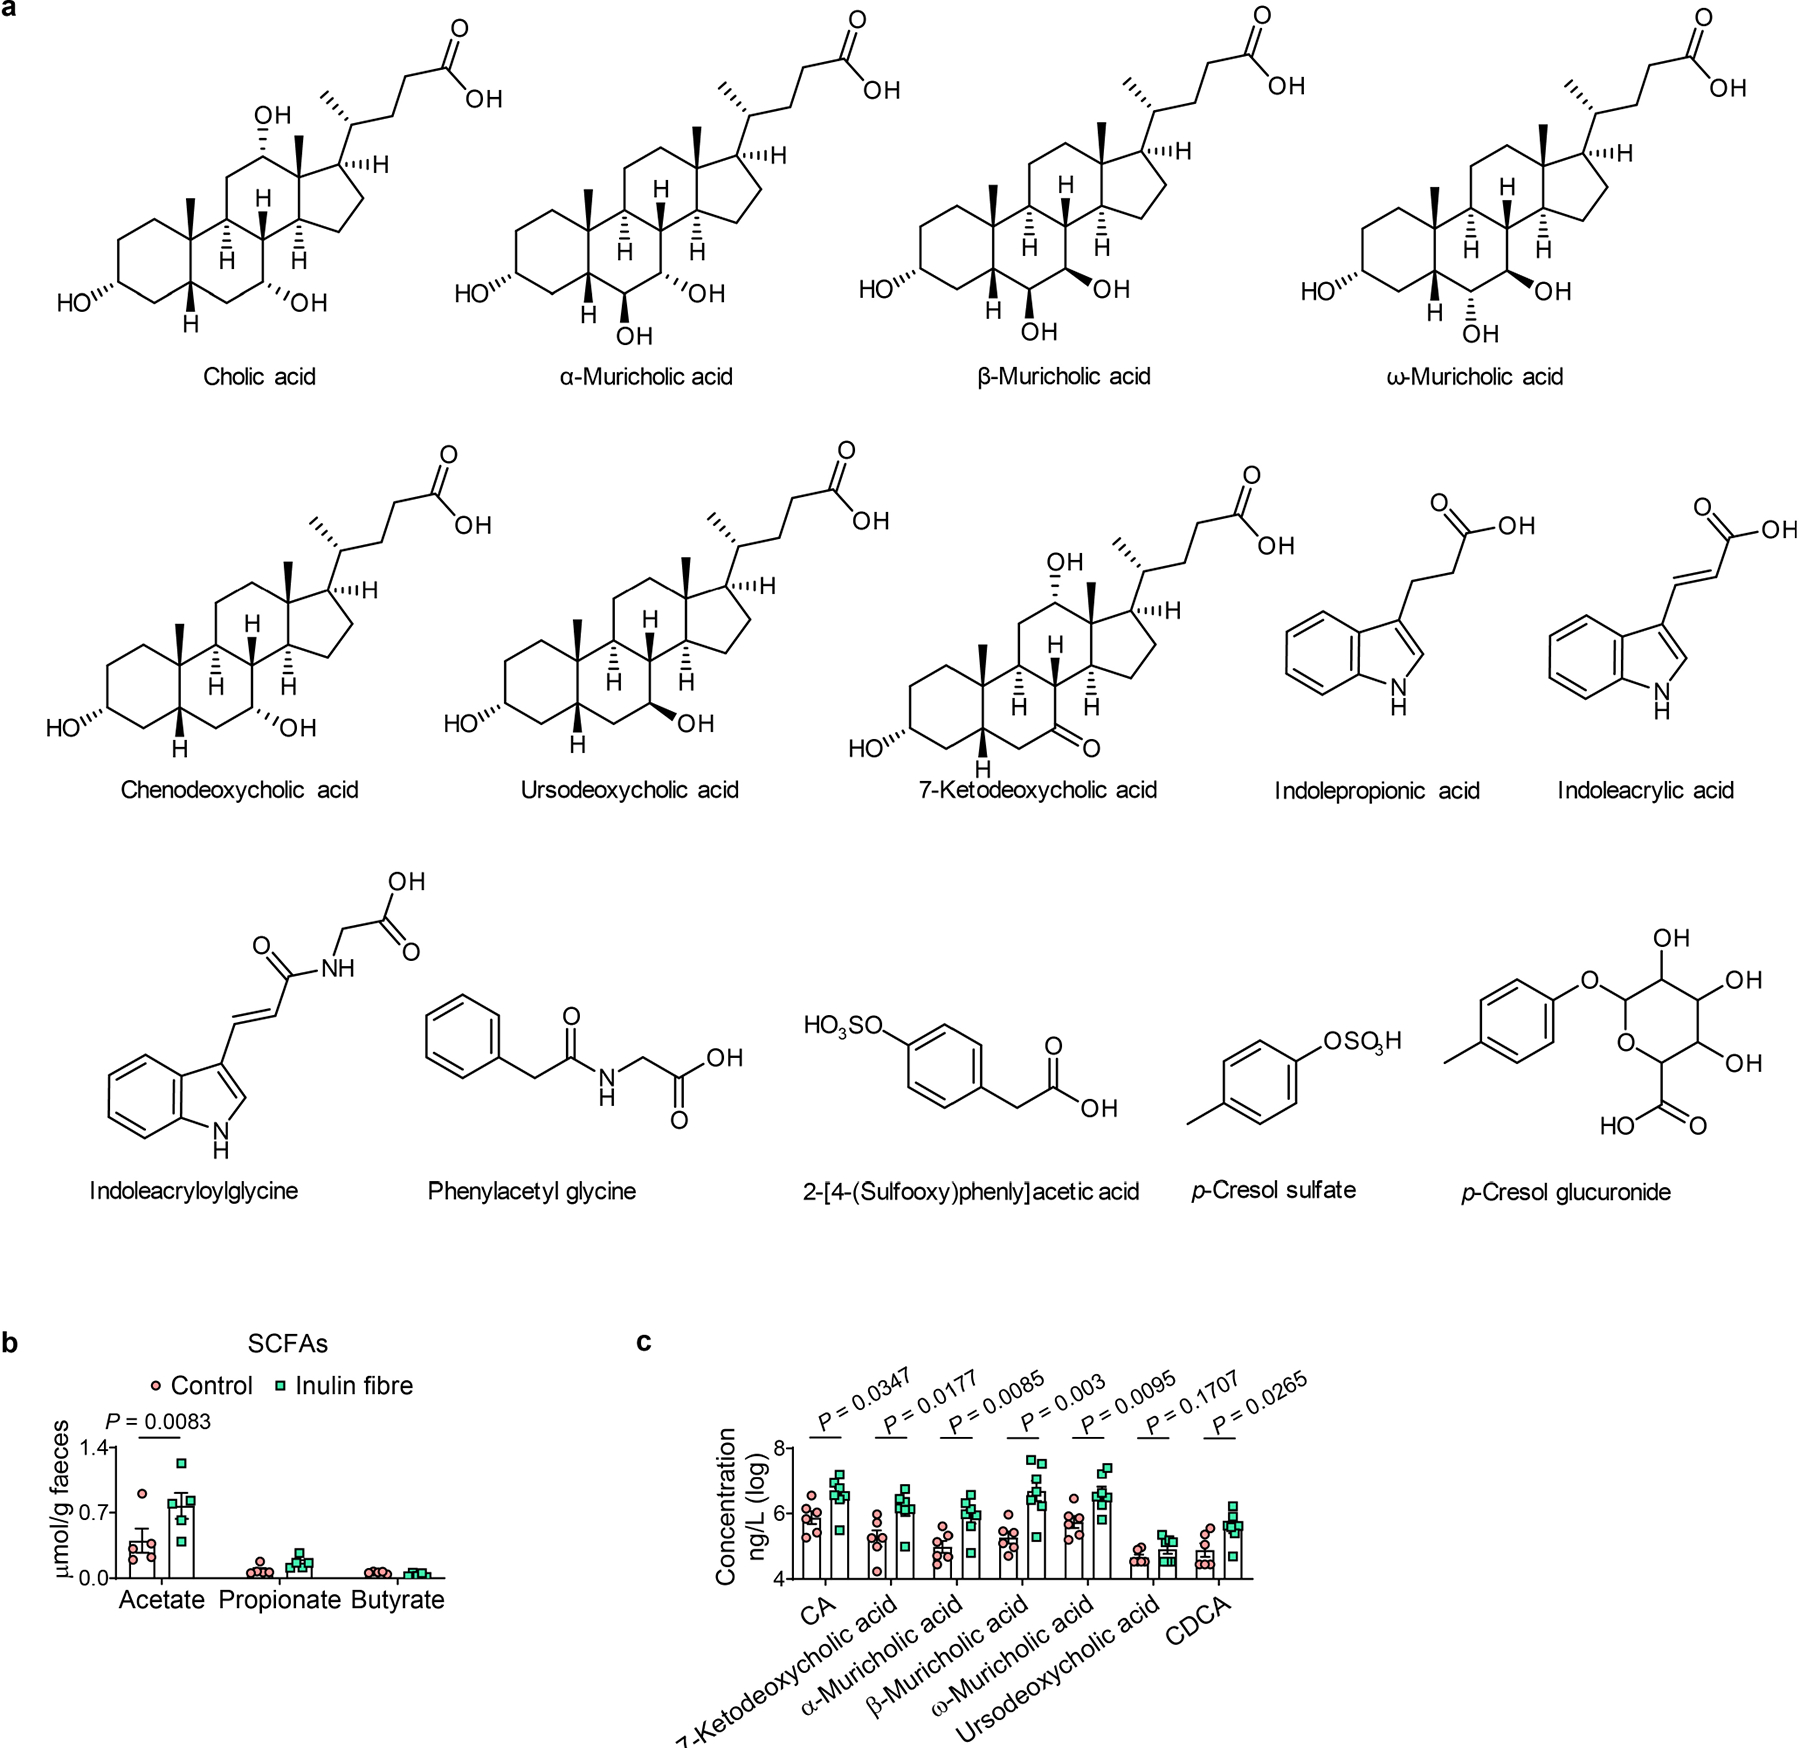
a, Chemical structures of major differentially abundant compounds identified in this study. b, Faecal concentration of SCFAs in mice from control and inulin fibre diet groups (n = 5 mice). c, Integration of serum bile acids shown in Fig. 1d (n = 6 mice for control or 7 mice for inulin fibre). Data in b,c are representative of at least two independent experiments. Data are means ± s.e.m. Statistics were calculated by two-way ANOVA with Šidák’s multiple-comparisons test (b) or unpaired two-tailed t-test (c).