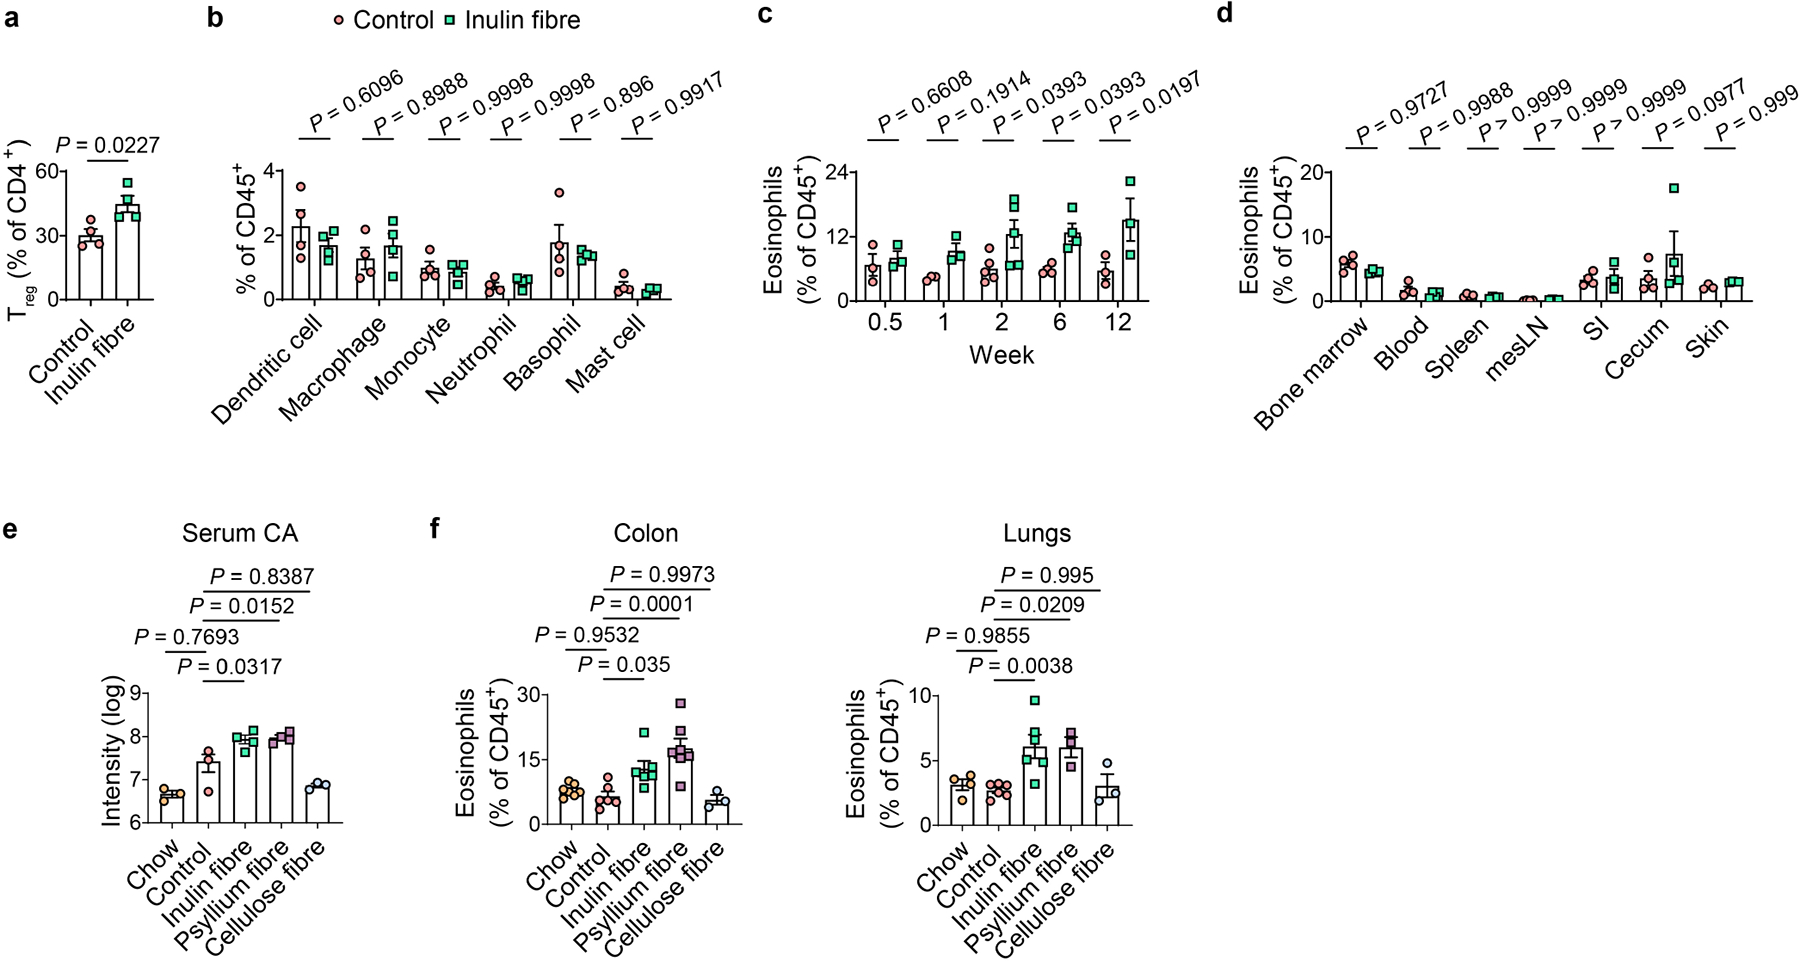
Extended Data Fig. 5 |. Effects of inulin fibre diet on immune cells in various tissues.

a,b, Mice were fed control or inulin fibre diet for two weeks (n = 4 mice). Bar graph shows frequencies of FoxP3+ Treg cells (a) and various immunocytes (b) in the colonic lamina propria of control or inulin fibre diet-fed mice. c, Frequency of colonic eosinophils in mice fed control or inulin fibre diet for the indicated periods of time (n = 3 mice for 0.5-, 1-, or 12-week timepoints, n = 5 mice for 2-week timepoint, and n = 4 mice for 6-week timepoint). d, Percentage of eosinophils in various tissue sites from mice administered control or inulin fibre diet for two weeks. mesLN, mesenteric lymph nodes; SI, small intestine. n = 4 for bone marrow, blood, spleen, mesLN, caecum, SI control or skin inulin fibre, n = 3 for SI inulin fibre or skin control. e,f, Mice were fed chow, control diet, or various high fibre diets, and serum levels of CA (e) were measured after two weeks (n = 3 mice for chow, control, or cellulose fibre, and n = 4 mice for inulin or psyllium fibre). Frequency of eosinophils in the colon and lung (f) of mice fed the indicated diets for two weeks (n = 7 mice (colon) or 4 mice (lung) for chow, n = 6 mice for control or inulin fibre, n = 3 mice for cellulose fibre, and n = 7 mice (colon) or 3 mice (lung) for psyllium fibre). Data are representative of (a–d) or combined (e,f) from two independent experiments. Data are means ± s.e.m. Statistics were calculated by unpaired two-tailed t-test (a), two-way ANOVA with Šidák’s (b,d) or Holm–Šidák’s (c) multiple-comparisons test, or one-way ANOVA with Šidák’s multiple-comparisons test (e,f).
