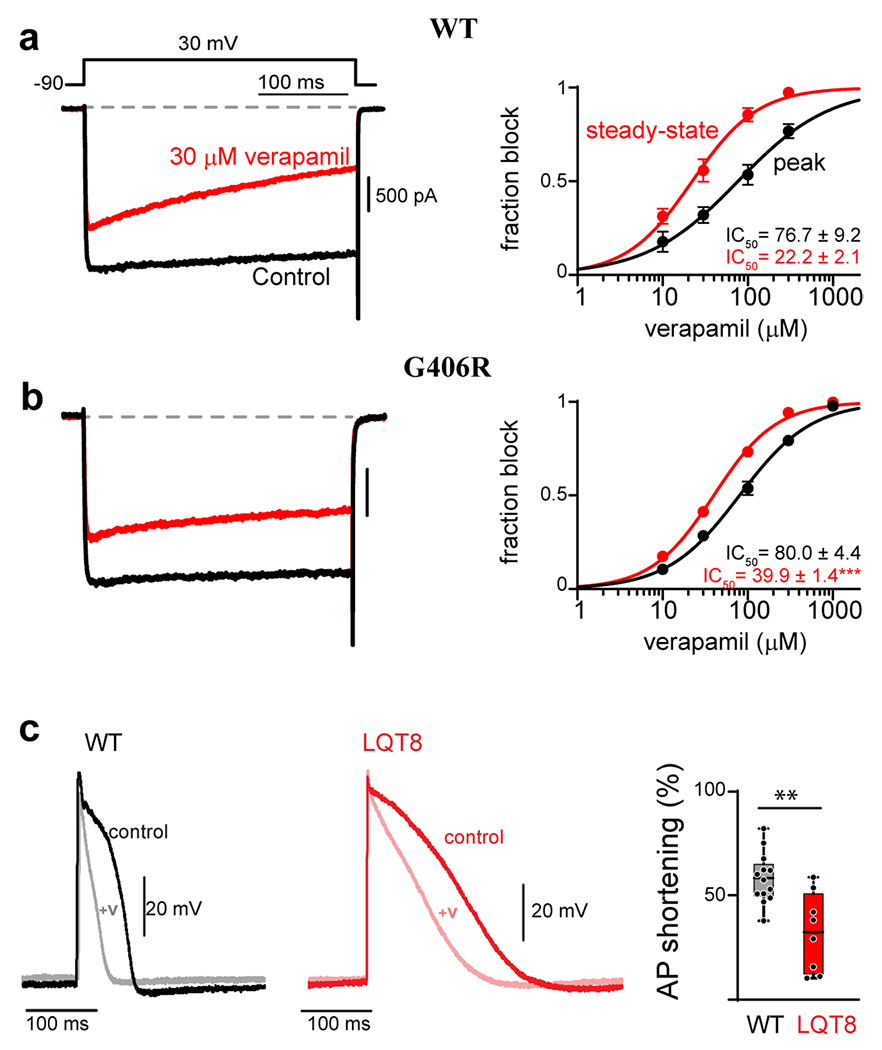
Figure 3. CACANA1C mutations reduce the efficacy of verapamil.

(a) Verapamil concentration-response curves measured for WT CaV1.2 in HEK 293 cells. Left: Exemplar Ba2+ current before (black) and after (red) the addition of 30 μM verapamil. Accumulation of block can be seen during the 300 ms depolarization in the presence of verapamil (red). Right: concentration-response curves can be generated by measuring the effect of the drug on the peak current amplitude immediately following depolarization (black), or at the end of the voltage step after 300 ms depolarization (red). The increased block measured from the steady-state value (red) is indicative of use-dependence of the drug. (b) The G406R mutation significantly reduces the use-dependent block of verapamil, seen as an increase in steady-state IC50. (c) Left: Exemplar AP recordings of WT iPSC derived cardiomyocytes before (black) and after (gray) the addition of 10 μM verapamil. Middle: Exemplar AP recording from an iPSC derived cardiomyocyte from a patient harboring the G406R mutation (red, LQT8) shows significant prolongation of the action potential as compared to WT (left, black). Addition of 10 μM verapamil (pink) reduces the AP duration to a lesser extent as compared to WT iPSC derived cardiomyocytes. Right: Quantification of the percent of AP shortening in WT vs. LQT8 (G406R) containing iPSC derived cardiomyocytes demonstrates a significant deficit in verapamil’s ability to shorten the AP in the context of patient derived cells harboring the G406R mutation (LQT8). Reproduced with permission from (Dick et. al., 2022, JMCC)(137).
