
Fig. 8:
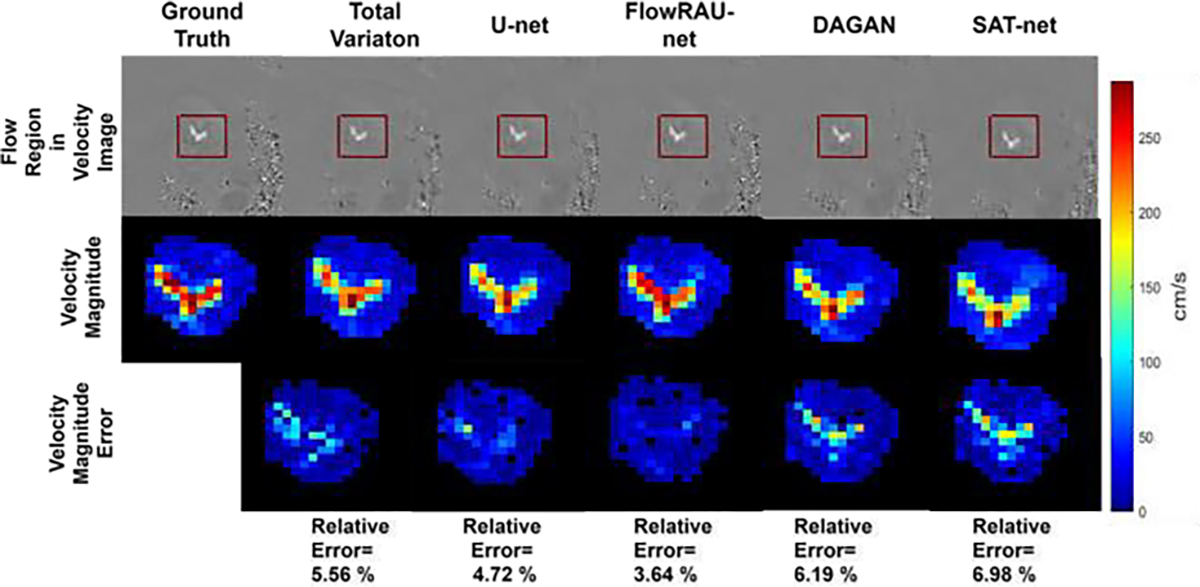
Comparison of velocity magnitude in flow region for different reconstruction methods in one patient in-vivo. The first row shows the blood flow region in a velocity image (FH Encoding) by a rectangular red box. The second row shows the zoomed-in velocity magnitude, and the third row shows the velocity magnitude error image as the absolute difference from the reference image. Velocity magnitude images are shown at an axial slice of aortic valve location and at peak systole phase of the cardiac cycle.