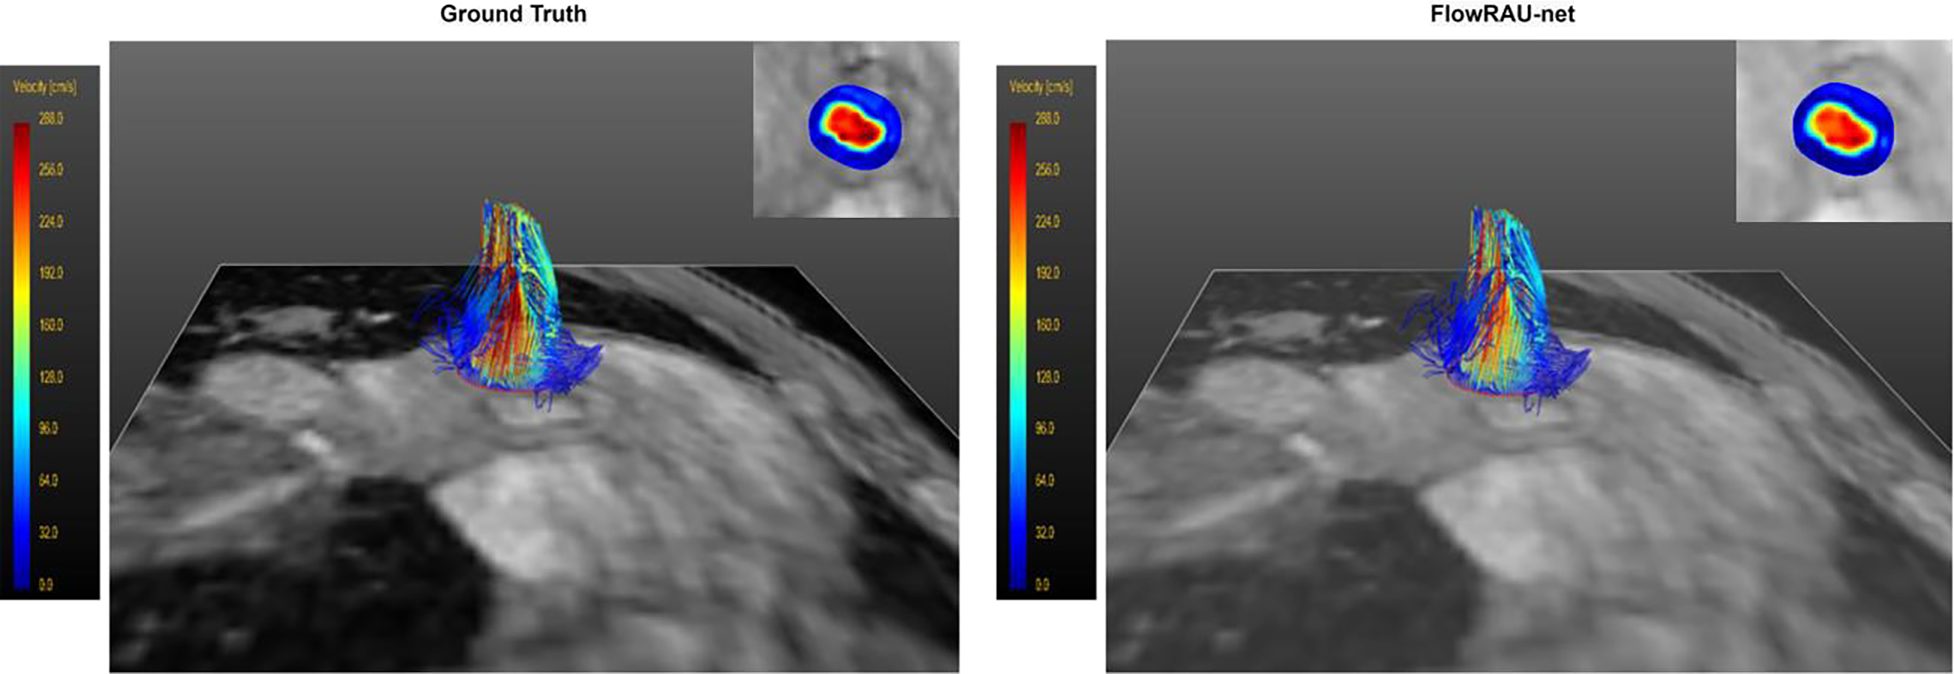
Fig. 9:

Velocity pathline in 3D view for flow at the level of aortic valve at peak systole in a healthy volunteer. The pathline of reference fully sampled 4D flow is shown on the left and the pathline for reconstructed 4D flow by FlowRAU-net is shown on the right. Corresponding velocity magnitude in an axial slice of the aortic valve is shown in the inset.
