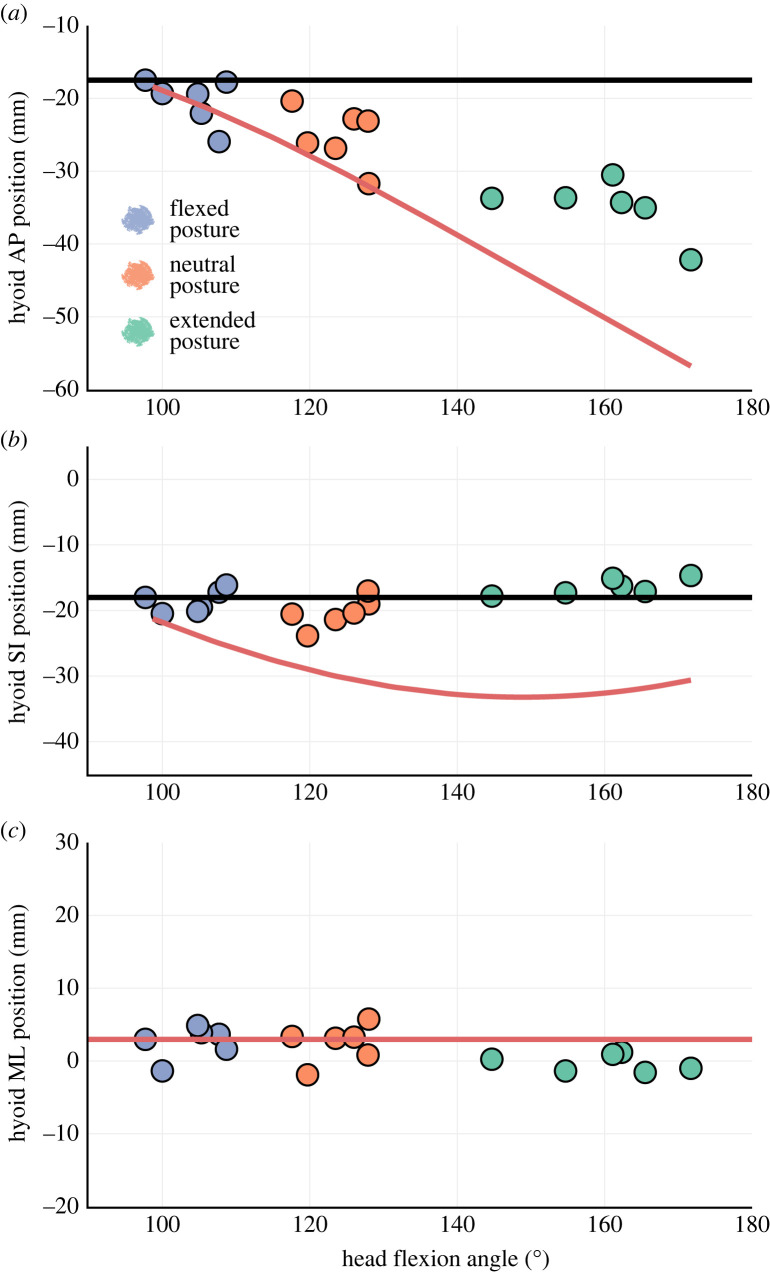
Figure 3.
Coupling between static hyoid position and head posture varies across anatomical axes. Observed hyoid position across head posture change at small gape is plotted along AP (a), SI (b) and ML (c) axes against theoretical expectations of hyoid position. Data for medium and large gape are shown in the electronic supplementary material, figure S4. Horizontal lines (black in (a) and (b), red in (c)) show theoretical hyoid position if it is perfectly coupled to the cranium, while red curves in (a) and (b) represents theoretical hyoid position if it is perfectly coupled to the vertebral column.

