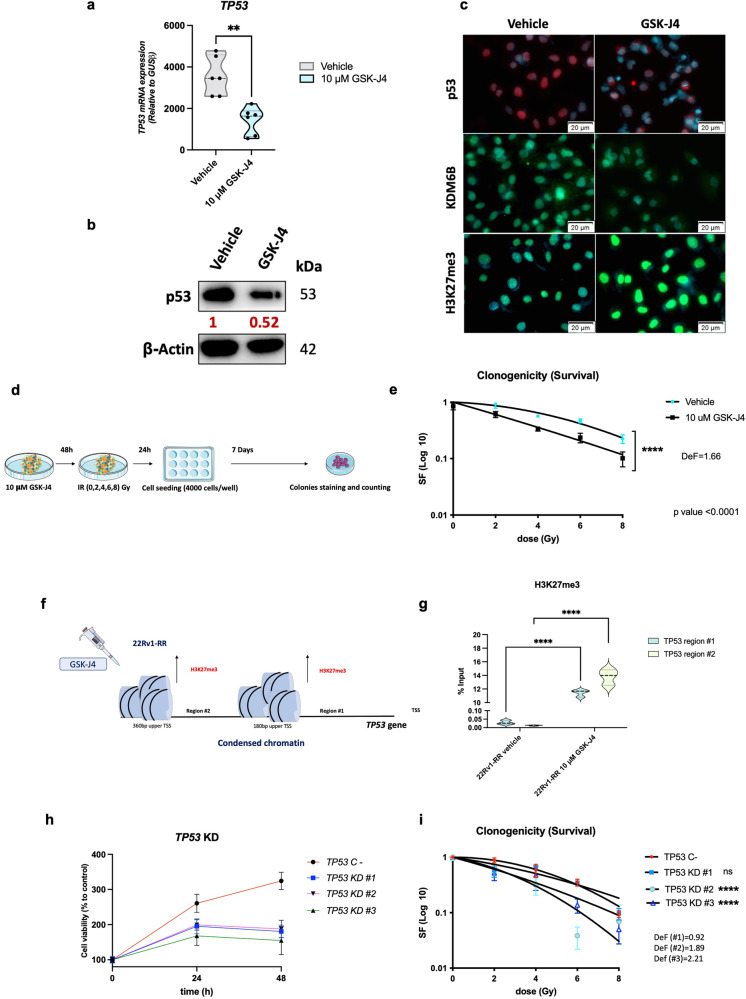
Fig. 4.
TP53 epigenetic silencing leads to the mitigation of radioresistant phenotype in 22Rv1-RR cells. a Relative mRNA expression levels of TP53 gene for 22Rv1-RR GSK-J4-treated cells and vehicle control (DMSO), normalized by GUSB gene expression levels (housekeeping). Results are presented as mean ± SD of at least three independent experiments. **P value < 0.01. b Total protein levels of p53 (53 kDa) to compare between 10 μM GSK-J4-treated 22Rv1-RR cells and the vehicle (DMSO). β-actin (42 kDa) was used as loading control. Images were taken by the Chemidoc detection system (Biorad, Berkeley, California). Optical density values were obtained using ImageJ software version 1.53 (National Institutes of Health). Values are representative of GSK-J4 vs. vehicle of at least three independent replicates. c DAPI merged images of nuclear immunofluorescent staining of p53 (red) and H3K27me3 (green) and cytoplasm/nuclear staining of KDM6B (green), for 22Rv1-RR GSK-J4-treated cells and vehicle control (DMSO). Images were taken using Olympus IX51 microscope at ×400 magnification (scale bar 20 μm). d Schematic representation of colony formation assay experiments for GSK-J4 treatment. e Cell survival fraction of 22Rv1-RR treated with 10 μM of GSK-J4 and vehicle cells represented through linear-quadratic model (LQ = (S = e – (xD + BD2))), ****P value < 0.0001, with a dose-enhancement factor (DeF) of 1.66. f Representative scheme of TP53 promoter epigenetic regulation upon GSK-J4 treatment in 22Rv1-RR cells. In red is represented the transcription repression-related marker, H3K27me3. g The graph represents H3K27me3 %input values (ChIP-qPCR) at TP53 gene promoter in regions #1 and #2 (180 bp and 360 bp upper TSS, respectively). The violin plots were represented by mean ± SD of at least three independent replicates. ns non-significant; **P value < 0.01; ****P value < 0.0001. h Cell viability assay for 22Rv1-RR negative control (TP53 C-) and TP53-KD clones #1 to #3 at 24 h and 48 h. i Cell survival fraction of 22Rv1-RR-negative control (TP53 C-) and TP53-KD clones #1 to #3 transfected cells represented through linear-quadratic model (LQ = (S = e – (αD + βD2))), ns, non-significant; ****P value < 0.0001. Results are presented as mean ± SD of at least 3 independent experiments. bp base pairs, Def, dose enhancement factor, KD knockdown, RR radioresistant, TSS transcription starting site

