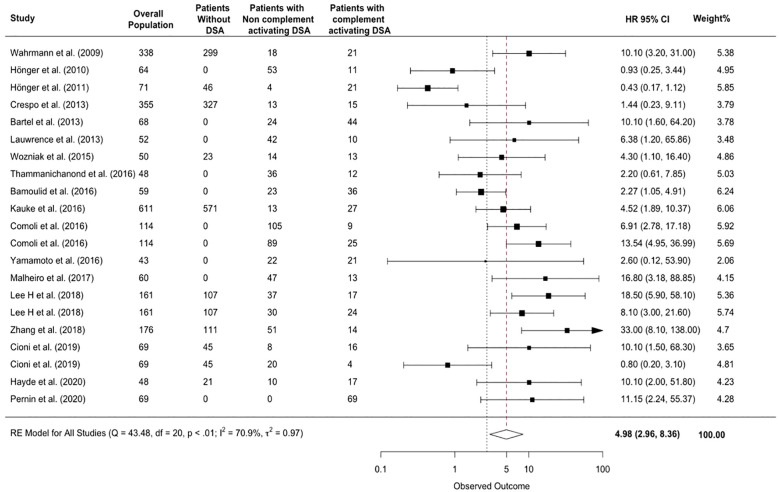
Figure 3.
Association between complement-activating anti-HLA DSAs and the risk of rejection. The figure shows the forest plot of the association between complement activating anti-HLA DSAs and the risk of rejection for each study and overall (n = 17). Studies are listed by date of publication. The black square-shaped boxes represent the HR for each individual study. The black square-shaped boxes represent the HR for each individual study. The size of these boxes represents the weight of the study, and lines represent the 95% CI for individual studies. The diamond at the bottom represents the overall HR. CI, confidence interval; DSA, donor-specific antibody; HLA, human leukocyte antigen; HR, hazard ratio.

