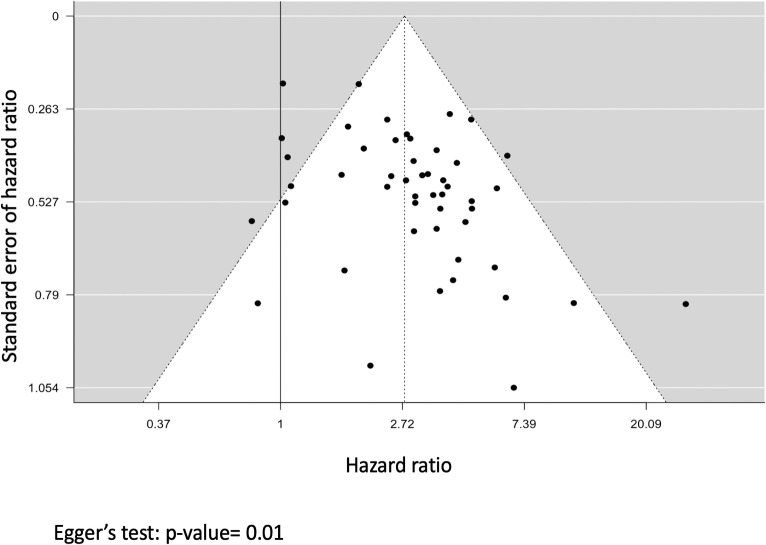
Figure 4.
Funnel plot representing the analysis for small-study effects. Each black dot represents a study; the x-axis represents the study effect size (hazard ratio), and the y-axis represents the standard error of the hazard ratio. The dashed vertical line represents the overall risk estimate and the black line represents the no intervention effect.

