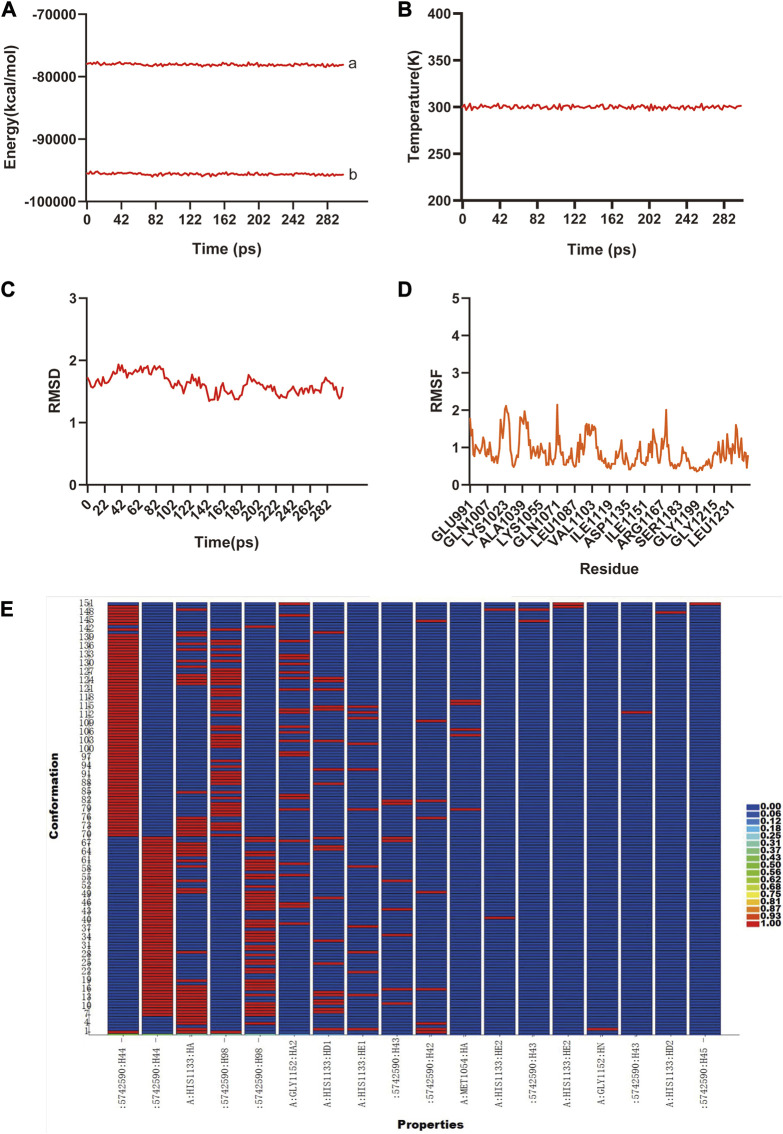
FIGURE 6.
The molecular dynamic simulations to calculate the binding stability of sitogluside–IGF1 complex. (A), The total energy (a) and potential energy (b) curves of the whole ensemble in 300 ps simulation, showed the stability. (B), The temperature alteration of whole ensemble is controllable in 300 ps simulation. (C), The RMSD curve present the conformational alternation of receptor made by ligand. (D), The RMSF curve showed the conformational alternation of amino acid residues. (E), The hydrogen bond heat map of sitogluside–IGF1 complex.

