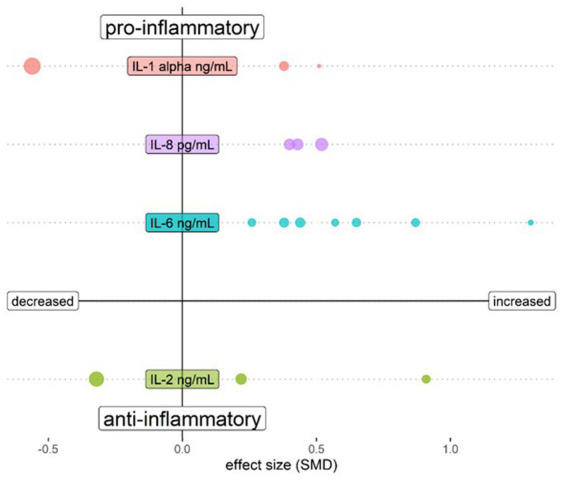
Figure 1.

Bubble plot showing changes of cytokines assessed in CSF of schizophrenia patients compared to healthy controls. Both upper quadrants show the pro-inflammatory cytokines IL-1 β, IL-6 and IL-8 and the lower quadrants show anti-inflammatory cytokine IL-2. The left quadrants indicate a lower cytokine level in schizophrenia and the right quadrants a higher level. Each bubble represents a study and the magnitude of the bubble is calculated from the percentage of patients with the respective change of the cytokine relative to total patients assessed for the specific cytokine. Data are shown for cytokines tested in at least 3 studies in Orlovska-Waast et al., (26). Figure created with R-statistics 4.2.2.
