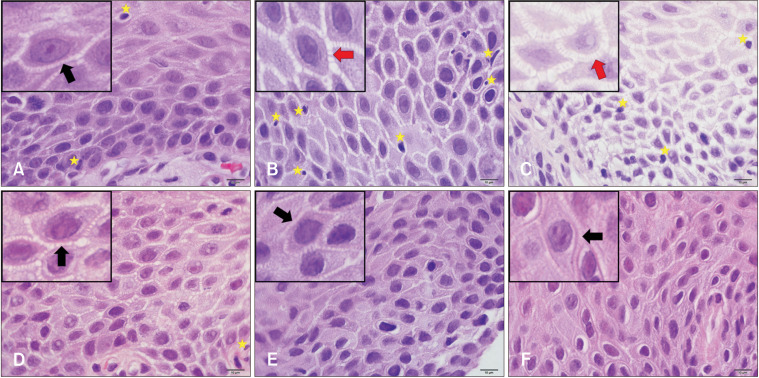
Figure 2.
Histological images of healthy control (HC), gastroesophageal reflux disease phenotypes, and functional heartburn (FH) at 1000× magnification. (A) HC, (B) mild erosive reflux disease (ERD), (C) severe ERD, (D) nonerosive reflux disease, (E) reflux hypersensitivity, (F) FH. Small boxes on the upper left corner were zoomed with software to focus on one epithelial cell. Black arrows indicate intercellular spaces. Red arrowheads indicate dilated intercellular spaces. Yellow stars indicate lymphocytes. Bars = 10 μm.

