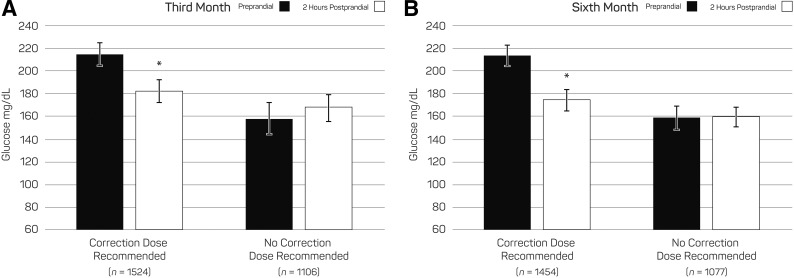
FIGURE 3.
Preprandial and postprandial glucose. Preprandial and postprandial average glucose are shown for the third month of use when the system displayed an HCP-recommended correction dose versus when no correction was suggested (A). Similar preprandial and postprandial average glucose data are shown for the sixth month (B). In both A and B, data represent mean and 95% CI. *Difference in postprandial glucose from the preprandial glucose is statistically significant (P <0.05) using the paired t test.

