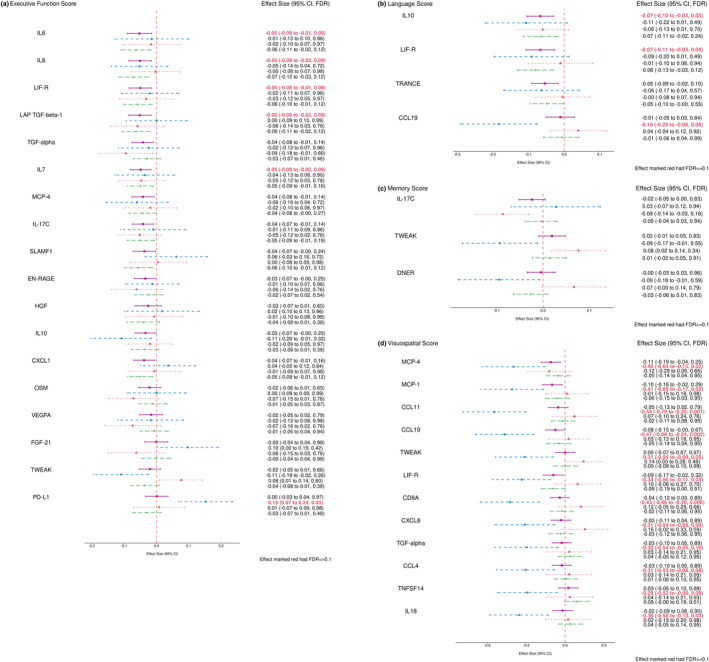
FIGURE 2.

Forest plots of combined and stratified protein effect size for significant associations within four cognitive domains using Model 2 (FDR ≤ 0.1). (a) Proteins associated with executive function domain score; (b) Proteins associated with language domain score; (c) Proteins associated with memory domain score; (d) Proteins associated with visuospatial domain score. The covariates adjusted in Model 2 included: sex, age, education level, time in years between Exam 7 (blood sample) and cognitive testing date, a retest indicator, APOE genotype, indicators for prevalent cardiovascular diseases (CVD) such as prevalent stroke, prevalent CVD, and prevalent atrial fibrillation (AF) at Exam 7, and the CVD risk factors such as systolic and diastolic blood pressures (mmHg), diabetes status, treatment for hypertension, body‐mass index (kg/m2), current smoking status, total cholesterol level (mg/dL), high‐density lipoprotein cholesterol levels (HDL, measured in mg/dL), and use of lipid‐lowering agents at Exam 7. The pink square represented the combined sample (N = 708), the blue circle represented the ε2 Carriers (N = 87), the red triangle represented the ε4 Carriers (N = 133), and the green diamond represented the ε3ε3 subgroup (N = 468). APOE, apolipoprotein E, CI, confidence interval; FDR, false discovery rate.
