
FIGURE 1.
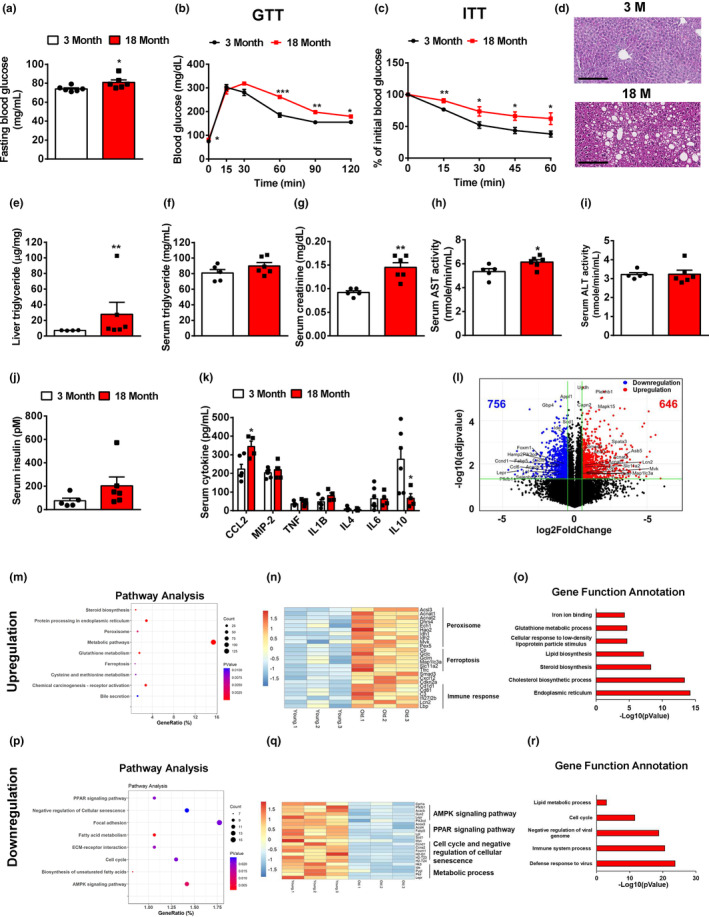
Lipid and glucose homeostasis are impaired in old mice. (a) Overnight (16 h) fasting blood glucose levels in young and old mice, n = 6 mice/group. (b) Glucose tolerance tests in young and old mice, n = 6 mice/group. (c) Insulin tolerance tests in young and old mice, n = 6 mice/group. (d) H&E staining of the livers of young and old mice. Representative images were shown. (e) Liver triglycerides in young and old mice, n = 4–6 mice/group. (f–j) Serum triglyceride (f), creatinine (g), AST (h), ALT (i), and insulin (j) in young and old mice, n = 5 mice/group. (k) Serum cytokine levels in young and old mice, n = 5–8 mice/group. (l) Volcano plot of hepatic gene expression in young and old mice analyzed by RNA‐Seq of total liver mRNA. (m) Pathway analysis of upregulated genes in the livers of old mice. (n) Heatmap of representative genes upregulated in the livers of old mice. (o) Gene function annotation of upregulated genes in the livers of old mice. (p) Pathway analysis of downregulated genes in the livers of old mice. (q) Heatmap of representative genes downregulated in the livers of old mice. (r) Gene function annotation of downregulated genes in the livers of old mice. All data are presented as mean ± SEM. *p < 0.05, **p < 0.01, ***p < 0.001.