
FIGURE 3.
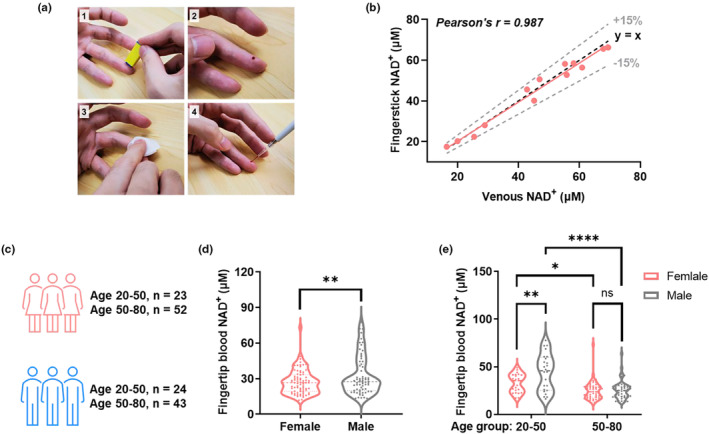
Fingertip blood NAD+ measurement for mapping NAD+ disparity. (a) Procedures of taking fingerstick capillary blood for NAD+ measurement. (b) Comparison between NAD+ levels measured from fingertip and venous blood. The Black dashed line indicates y = x, and the gray dashed line indicates ±15% deviation from y = x. (c) Study design for mapping fingertip blood NAD+ levels for healthy volunteers with different age and gender. (d) Female participants (n = 75) showed a significantly lower NAD+ level than males (n = 67) in this study. (e) 50–85 age group has significantly lower NAD+ levels than 18–50 age group for both male and female. The male has higher NAD+ level than female for 18–50 age group but not for the 50–85 age group. Significance was determined using t‐test for (d) and two‐way ANOVA analysis for (e), * p < 0.05, ** p < 0.01, **** p < 0.0001.