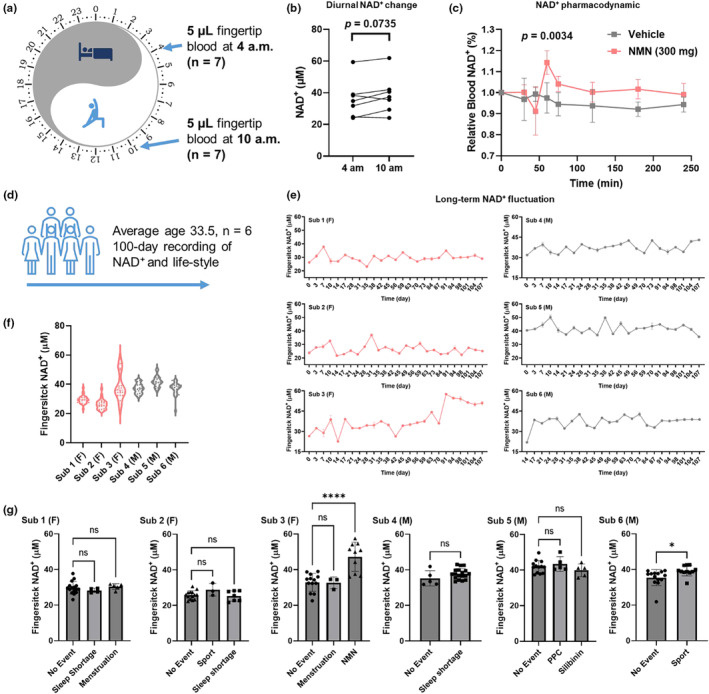
FIGURE 4.

Monitoring real‐world NAD+ dynamics using capillary blood. (a) Study design for comparing capillary NAD+ levels at 4 and 10 am. (b) No significant difference in NAD+ level was observed for capillary blood samples obtained at 4 and 10 am. (n = 7, p = 0.0735), though the average NAD+ level increased from 36.00 μM to 38.69 μM. (c) Oral administration of 300 mg NMN induced short‐term capillary NAD+ spike with significant increases recorded at 60 min (n = 5, p = 0.0034). (d) Scheme for the long‐term monitoring of NAD+ levels. Events including sport, sleep shortage, medication, menstruation, and dietary supplementation were recorded through questionnaire. (e) NAD+ dynamics recorded for n = 6 participants over three months. F and M indicates female and male subjects respectively. (f) Distribution of fingerstick NAD+ levels during the long‐term monitoring. (g) Effects of events on NAD+ levels for each subject. NMN and sport significantly increased NAD+ levels for sub 3 and 6 respectively. Only days with single recorded event were considered, while days with more than one recorded event were excluded from the analysis. Significance was determined using t‐test for (c) and sub 4 & 6 in (g). Two‐way ANOVA analysis was used for significance determination for sub 1, 2, 3 and 5 in (g), * p < 0.05, **** p < 0.0001.
