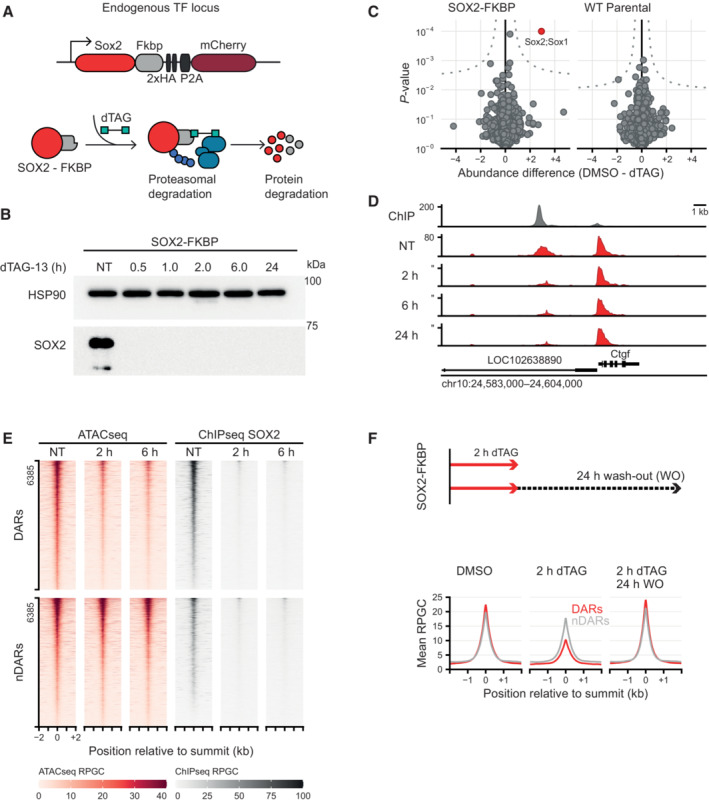
Figure 1. Rapid depletion of SOX2 and OCT4 affects the accessibility landscape of thousands of sites.

- Schematic representation of the dTAG system, wherein an FKBP‐tagged protein can be proteasomally degraded upon addition of the dTAG‐13 small molecule.
- Western blot showing protein abundance of SOX2 upon addition of dTAG‐13 for the indicated times in SOX2‐FKBP cell lines. HSP90 was used as loading control (NT, Not Treated).
- Quantitative mass spectrometry results showing the differential protein abundance upon 30 min of dTAG treatment versus DMSO treated SOX2‐FKBP cells and parental (untagged) cells.
- Genomic tracks showing SOX2 binding by ChIPseq (gray) and accessibility by ATACseq (red) around the Ctgf gene for SOX2‐FKBP cell line after indicated times of depletion by dTAG treatment. Y‐axes show reads per genomic content (RPGC).
- Heatmap showing accessibility and SOX2 ChIPseq before and after dTAG treatment in SOX2‐FKBP cell line at SOX2 peaks that are differentially accessible regions (DAR) or where no differentially accessible region is detected (nDAR) partially matched for SOX2 binding.
- Top: Experimental procedure for SOX2 ATACseq after wash‐off of dTAG. Bottom: Average profile of ATACseq in SOX2 degradation system and restoration of SOX2 after 2 and 24 h of dTAG wash‐off at the same DARs/nDARs as in (E).
Source data are available online for this figure.
