
Figure EV1. Loss of accessibility after pioneer factor loss.
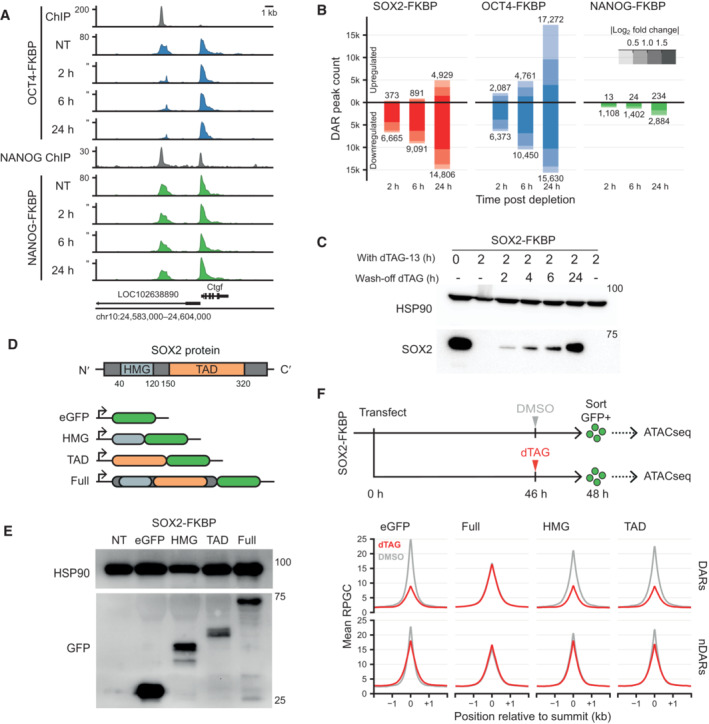
- Genomic tracks of accessibility changes by ATACseq in OCT4 and NANOG FKBP tagged lines measured in untreated condition (NT) and after OCT4 and NANOG depletion at the indicated timepoints. ChIPseq tracks for OCT4 in the OCT4‐FKBP line and NANOG from publicly available data are shown on top of ATACseq. Y‐axes refers to reads per genomic content (RPGC).
- Bar plot showing the number of differential accessible regions (DARs) after a time course of SOX2, OCT4 and NANOG depletion, in FKBP tagged lines.
- Western blot analysis of SOX2 expression level at 0 and 2 h of dTAG‐13 and during a time course of dTAG‐13 washoff. HSP90 was used as loading control.
- Schematic representation of SOX2 protein showing the DNA binding domain (HMG) and the trans‐activation domain (TAD). To generate versions of the protein for ectopic expression, the HMG, TAD or full length SOX2 was cloned in frame with the eGFP sequence in an episomal expression vector.
- Western blot using an antibody against eGFP shows the fusion proteins running at the expected size. HSP90 was used as a loading control.
- Top; Representation of the experimental procedure for ATACseq after ectopic expression of the truncated SOX2‐EGFP constructs. SOX2‐FKBP cells were transfected with the plasmids and seeded for DMSO or dTAG‐13 treatment. eGFP positive cells were sorted and ATACseq was performed on the eGFP expressing cells. Bottom; Line plot showing the average signal of ATACseq after overexpression of the plasmids after DMSO (gray) or dTAG13 treatment (red) for the endogenous SOX2‐FKBP degradation. The average ATACseq signal is plotted for the DARs and nDARs as identified in Fig 1F.
Source data are available online for this figure.