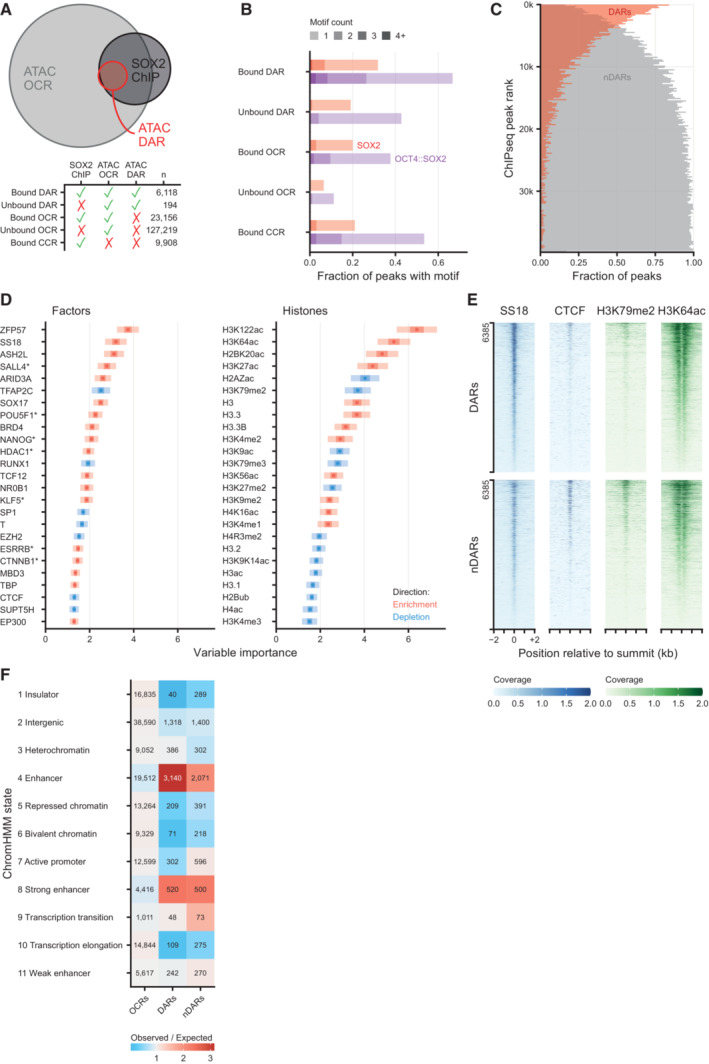
Euler diagram showing the overlap between differentially accessible regions (DARs) after 2 h of SOX2 depletion, all ATACseq peaks (OCR, open chromatin regions) and SOX2 DNA binding (SOX2 ChIP). Bottom panel shows the number of peaks in each overlap category. CCR: closed chromatin region, i.e., SOX2 ChIPseq peaks that do not overlap OCRs.
Fraction of peaks containing 1 or more OCT4::SOX2 or SOX2 DNA binding motifs, stratified by whether OCRs, DARs and/or SOX2 binding sites as measured by ChIPseq, or combinations thereof.
Vertical histogram of SOX2 ChIPseq peaks ranked by signal intensity, stratified by their overlap with downregulated DARs or lack of such overlap (nDAR), displayed in 200 peak bins.
Left, top 25 (chromatin binding) factors in the Cistrome factors datasets whose overlap with all ATACseq peaks is predictive in random forest classification to discriminate the DARs from non‐DARs (nDAR) peaks partially matched for SOX2 binding levels. ATACseq peaks were extended by 300 bp in both directions. Variable importance was calculated with subsampling inference, wherein the 95% confidence interval (CI) is indicated with a light color, the 50% CI with a darker color and the median with a point. Enrichment and depletion indicate higher and lower average overlap in the DAR than nDAR categories respectively. Right, top 25 histone modifications using the Cistrome histone datasets of 100 re‐sampling.
Tornado plots showing example differences between DARs and nDARs for SS18, CTCF, H3K79me2 and H3K64ac from publicly available ChIPseq datasets. Coverage indicates values in pre‐processed data.
Heatmap of ChromHMM defining chromatin states of different set of ATACseq peaks: other open chromatin regions (OCRs), DARs and partially SOX2‐binding matched nDARs. The expected value was calculated under independence of proportions assumption, as they are calculated for a chi‐squared test.

