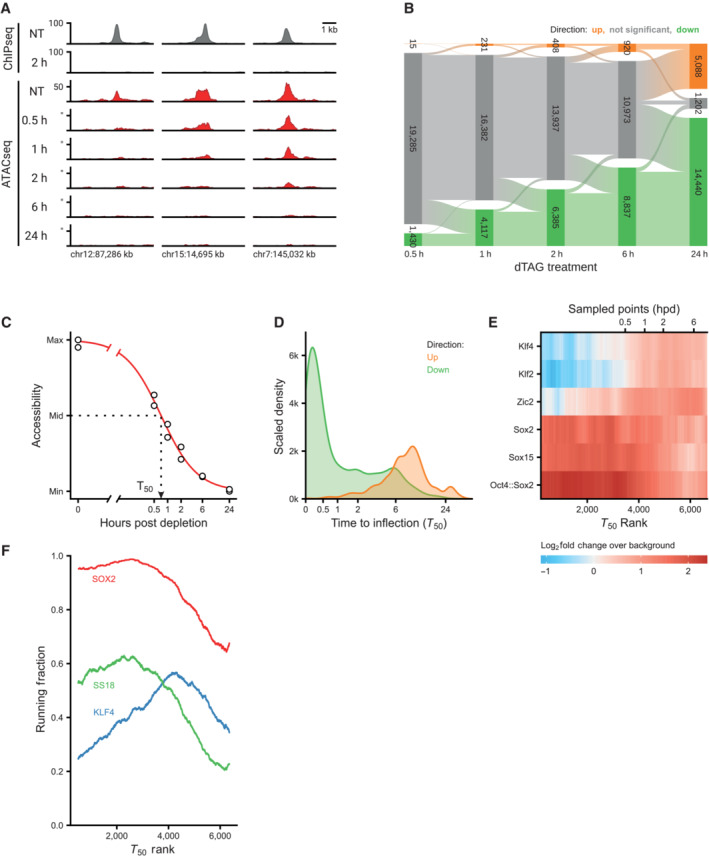
Example regions of changes in SOX2 occupancy measured by ChIPseq (to, in gray) and in accessibility as measured by ATACseq (red) during the SOX2 depletion time course. Y‐axis indicates reads per genomic content (RGPC).
Alluvial diagram shows the number of regions gaining accessibility (up, orange) or losing accessibility (down, green) over the SOX2 depletion time course.
Illustration of estimating the time to inflection (T
50) for a DAR, wherein a log‐logistic model is fit to the data over time after depletion.
Kernel density estimate of the time to inflection for DARs going up and down. The density is scaled such that the area under the curve integrates to the number of DARs. Time to inflection is displayed with inverse hyperbolic sine transformation.
Heatmap of motif enrichment displaying downregulated DARs on the X‐axis sorted by time to inflection. Colors display a fold change of a centered running mean, measuring the fraction of peaks containing the indicated motifs over a 400 peaks window, relative to the fraction of nDARs containing these motifs. Sampled time points are indicated at the bins where the time to inflection surpasses the sampled time.
Patterns of protein binding at sites ordered by their inflection time (T
50). Running fraction represents the fraction of peaks in a 1,000‐peak window that overlaps one of the specified ChIPseq datasets. The SS18 and KLF4 peaks were acquired from Cistrome, whereas the SOX2 peaks were taken from the SOX2‐FKBP line in the untreated condition.

