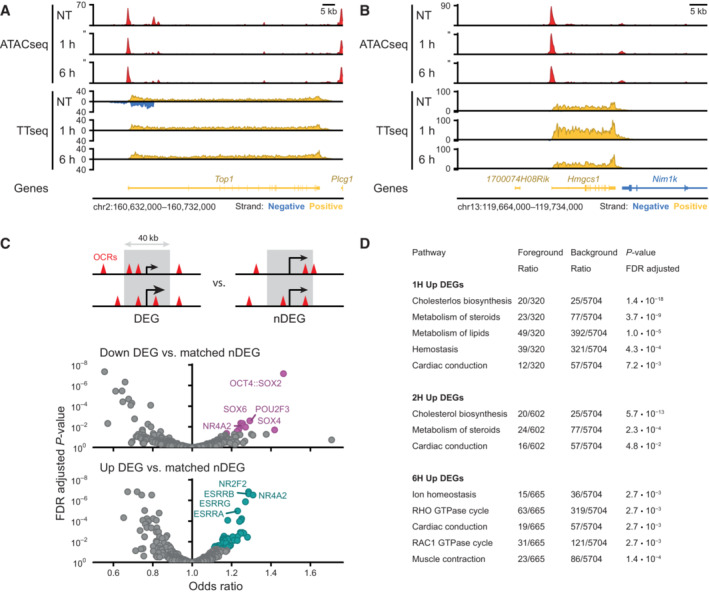
Figure EV3. Upregulation of transcripts following SOX2 depletion.

- Example region showing changes in accessibility measured by ATACseq and transcription measured by TTchemseq for the Top1 locus in untreated (NT), 1 and 6 h of dTAG‐13 treatment in SOX2‐FKBP cells. Y‐axes shows reads per genomic content.
- Same as in (A) but for Hmgcs1 locus.
- Top: schematic of the widow selected for motif analysis around differentially expressed genes (DEGs) and expressed matched control non‐DEGs (nDEGs). Bottom: volcano plot showing the motifs found in open chromatin regions (OCRs) in a 40 kb window centered on the TSSs of downregulated DEGs and at upregulated DEGs.
- Table showing reactome pathway (Gillespie et al, 2022) overrepresentation analysis results on TTchem‐seq DEGs.following SOX2 depletion. Table shows all significant hits at the FDR adjusted P‐value threshold lower than 0.05, stratified by timepoint and direction. For 0.5 h and downregulated DEGs, no significant pathway enrichments were found.
