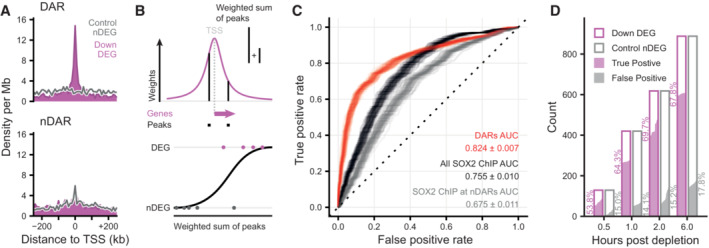
Figure 5. Open chromatin regions maintained by SOX2 are associated with transcription.

- Density of peaks in 10 kb bins nearby transcription start sites (TSS) of downregulated (purple) differentially expressed genes (DEGs) and expression‐matched stable control (gray) non‐DEGs (nDEGs). Panels indicate the set of peaks that were aligned to the TSS: differentially accessible regions (DARs) or stable non‐DARs (nDAR).
- Schematic illustration of taking the weighted sum of peaks per gene, weighted by a kernel function (top) followed by logistic regression predicting the differential expression status of a gene (bottom).
- Receiver operator characteristic (ROC) curves indicating the predictive strength on differential expression status of downregulated DEGs versus matched control nDEG, for various sets of predictors. The “DARs” set of predictors use peak categories of ATACseq data. The “All SOX2 ChIP” set has weighted sums of SOX2 ChIPseq peaks. The “SOX2 ChIP at nDAR” has weighted sums of the SOX2 peaks that do not overlap DARs. Different transparent lines indicate 100 re‐samplings of the expression‐matched nDEGs.
- Barplot showing the number of downregulated DEG (case) and nDEG (control) genes identified as true or false positive in the predictions with the “DARs” features at the indicated time points. Predictions were taken from ROC curves at the threshold of maximum accuracy. Filled area indicates complementary cumulative distribution function of counts under 100 re‐samplings of the expression‐matched nDEGs. Percentages indicate the average true and false positive rates of the different samplings.
