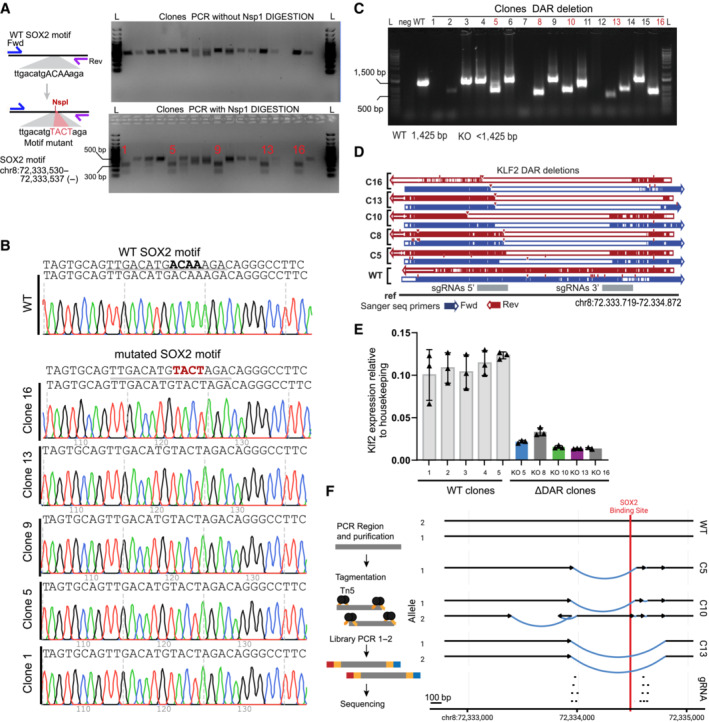
Figure EV5. Validation of genome editing of DAR KO and Klf2 gene expression.

- Left: schematic of the procedure used for editing and selection of clones with homozygous mutation of the motif. Right: Top, DNA gel electrophoresis of the PCR product related to region selected for point mutant. Bottom, digestion of the PCR product (top) using NspI. Homozygous clones show 2 bands. Unedited clones show 1 band. L, ladder.
- Sanger tracks for WT and motif mutant clones.
- Gel electrophoresis of PCR for genotyping disruption of the DAR region in clones from the gene edited SOX2‐FKBP parental cell line. Primers amplifying the targeted regions were used to control for the homozygous disruption compared to WT amplification. L: ladder, Neg: water control, DAR KO clones: clones selected for genotyping. In red, clones selected for further experiments.
- Validation of the disruption using Sanger sequencing in clones compared to non‐edited clones. Blue: forward primer, red: reverse primer, gray: region targeted by sgRNAs 5′ and 3′ of the DAR.
- RT–qPCR of Klf2 expression, similar as Fig 5B, but using an alternative set of primers, in 5 parental clones and the DAR KO clones. Expression is relative to housekeeping gene Rsp26. Error bar represent standard deviation of three biological replicates.
- Left panel shows simplified overview of the amplicon sequencing procedure. Right panel shows the most likely assembly based on the amplicon sequencing of the DAR regions in WT and KO clones. Region targeted by sgRNAs are shown at the bottom. Arrows indicate the centromere to telomere orientation. Black lines shows assembled sequence that is identical to the reference sequence. Blue lines show structural variants identified in the clones. Red indicates position of the SOX2 binding motif overlapping with a SOX2 ChIPseq peak.
