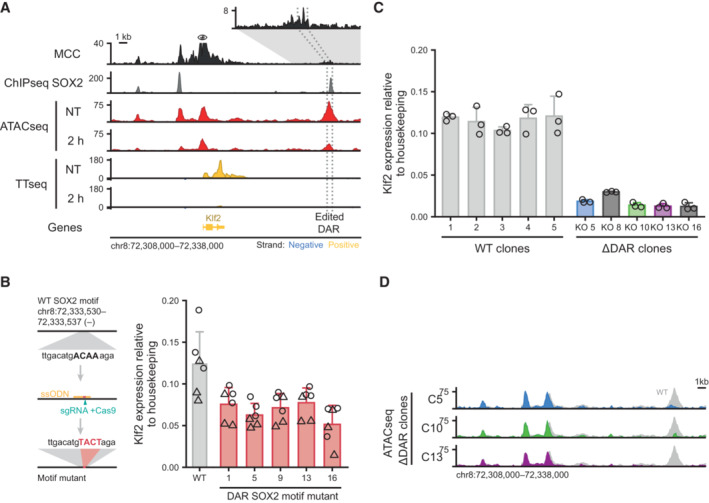
Figure 6. Klf2 transcription is dependent on a downstream regulatory element that is in physical proximity with the promoter.

- Genomic tracks showing physical interactions with the Klf2 promoter measured by micro‐capture‐C (MCC). SOX2 binding measured by ChIPseq is shown for the untreated (NT) condition. ATACseq and by TTchemseq data is shown for NT and 2 h dTAG‐13 treatment in SOX2‐FKBP cells. The eye symbol indicates the viewpoint for MCC. Contacts with a downstream DAR is shown in the zoomed‐in inset. Dotted lines indicate the region targeted for deletion. Y‐axes indicate reads per genomic content (RPGC).
- Left: schematic of the procedure to mutate the SOX2 motif. Right: bar plot showing Klf2 expression in wild‐type (WT) and mutant clones for the SOX2 motif. Error bars indicate standard deviation for three biological replicates. Two primers set (circle and triangle) are indicated.
- Barplot showing Klf2 expression in clones with intact (WT) and disrupted DAR (∆DAR) indicated in (A), as measured by RT–qPCR normalized to the Rsp26 housekeeping gene. Bar heights indicate means and error bars indicate standard deviation for three biological replicates.
- Genomic tracks showing ATACseq signal around the Klf2 locus upon knockout of the DAR indicated in (A) in three ∆DAR clones. In gray, accessibility of the NT sample in (A) is shown for comparison. Y‐axes indicate reads per genomic content.
