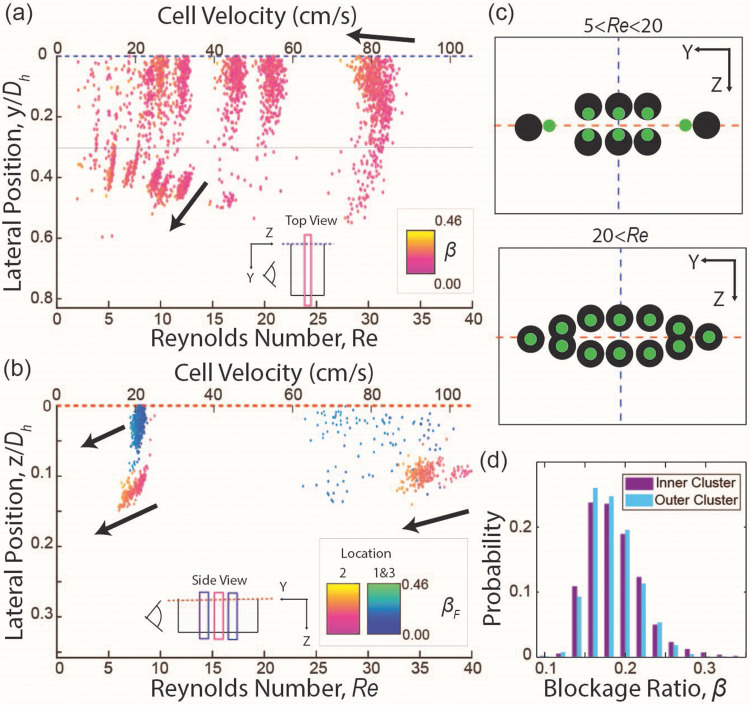
FIG. 3.
Results for elasto-inertial flow (0.05 w/v% of PEO in PBS) (a) and (b) lateral focusing position as a function of the cell speeds ( ) and color coded by blockage ratio, (β). (a) Results in a low aspect ratio channel. The gray line at = 0.3 represents the cutoff, where cells at 0.3 < are classified as focused in outer clusters, while cells at < 0.3 are classified as focused in inner clusters. (b) Results in a high aspect ratio channel. It should be noted that there is a significant spread in the data for locations 1 and 3 at because of unavoidable variations when centering the focal planes in the y direction. The arrows indicate an increase in the blockage ratio. (c) Schematic illustrating distinct cells focusing behaviors below and above the transition Reynolds number . (d) Histogram of blockage ratio: Probability distribution of blockage ratio for cells focused in the inner cluster and outer cluster in a low aspect ratio channel at was found to be indistinguishable.

