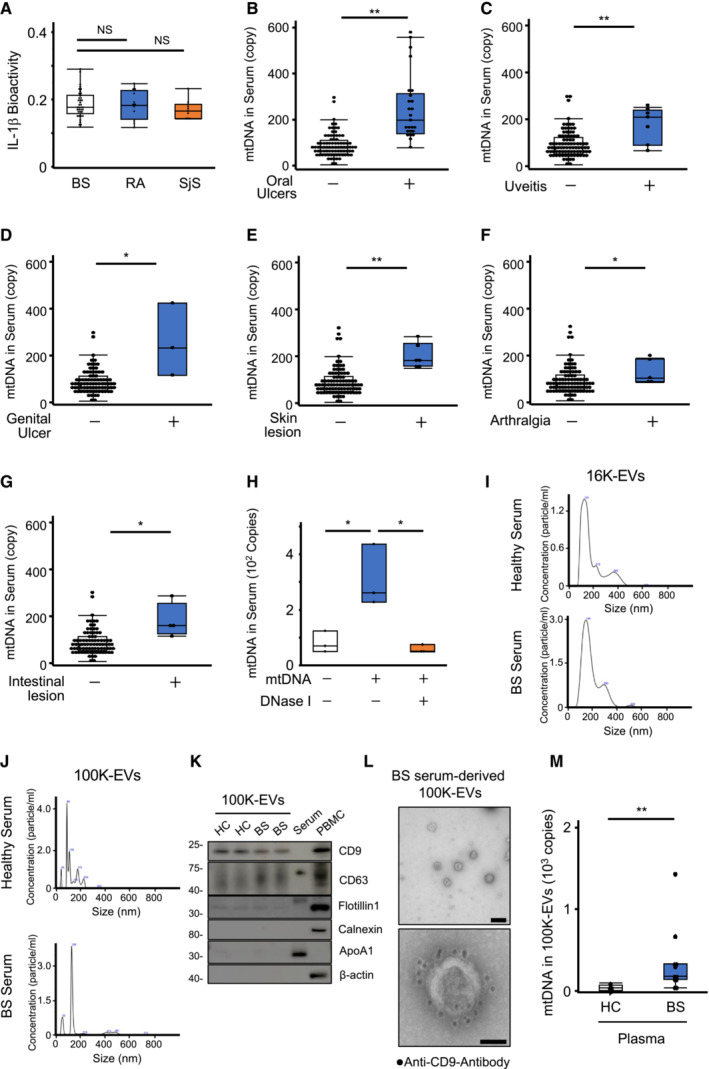
Figure EV4. Relationship between serum mtDNA levels and BS symptoms and characteristics of 100K‐EVs purified from human sera.

-
ASerum IL‐1β bioactivity. Serum IL‐1β levels in BS, RA, and SjS were evaluated using the reporter cells for IL‐1β.
-
B–GRelationship between serum mtDNA levels and BS symptoms. Serum mtDNA levels in BS patients were compared between asymptomatic patients and patients who exhibited any of the following symptoms on the sampling date: oral ulcers (B), uveitis (C), genital ulcers (D), skin lesions (E), arthralgia (F), and intestinal lesions (G).
-
HDegradation of mtDNA added to the serum by DNase I. mtDNA was spiked into the BS serum and digested by DNase I.
-
I–LCharacterization of EVs isolated from serum. Particle sizes of 16K‐EVs (I) and 100K‐EVs (J) isolated from HC (upper) or BS serum (lower). Representative exosome markers, such as CD9, CD63, and Flotillin 1, but not calnexin, apolipoprotein‐A1, or β‐actin, were present in 100K‐EVs isolated from serum (K). 100K‐EVs isolated from BS serum were attached to a coverslip and visualized through transmission immunoelectron microscopy using an anti‐CD9 primary antibody and a secondary antibody conjugated to 10‐nm gold particles. Scale bar, 200 nm (upper) and 50 nm (lower) (L).
-
MPlasma mtDNA levels in 100K‐EVs. 100K‐EVs were isolated from HC and BS plasma, and DNA was purified. The mtDNA levels in 100K‐EVs were measured using qPCR.
Data information: Statistical analyses were performed using a Mann–Whitney U test (B–G, M) (median; 25th and 75th percentiles; minimum and maximum value excluding outliers; *P < 0.05, **P < 0.01) or a Steel–Dwass test (A, H) (median; 25th and 75th percentile; minimum and maximum value excluding population outliers; *P < 0.05; NS, not statistically significant). The data are representative of two (M) and three (H) independent experiments.
Source data are available online for this figure.
