
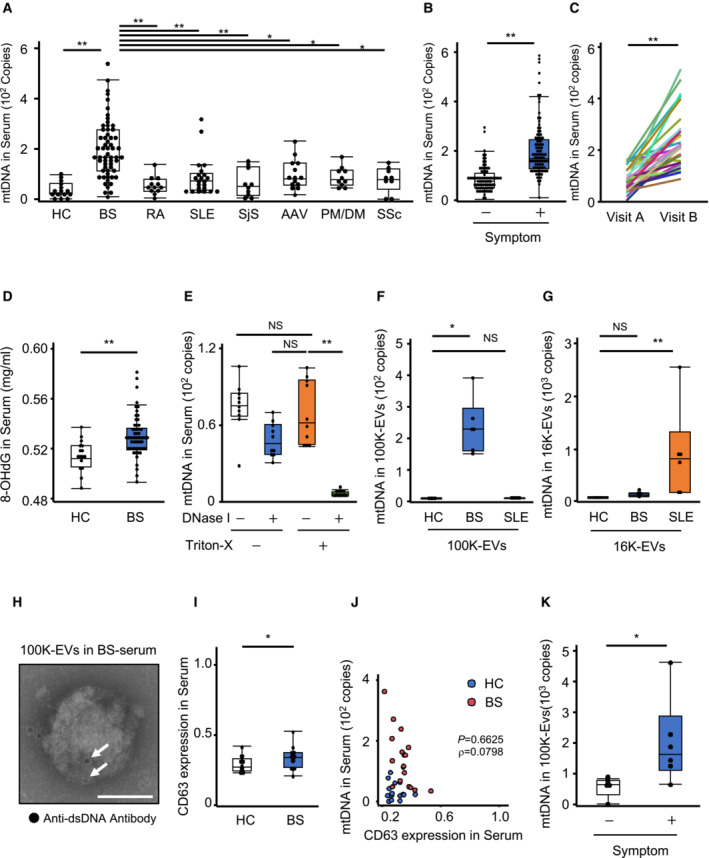
Figure 5. Increased mtDNA in exosomes in BS blood circulation.
-
ASerum mtDNA levels in patients with various autoimmune diseases. After the purification of DNA from the serum, the mtDNA levels were determined using qPCR targeting COXIII, which is encoded by mtDNA. Subjects: HCs (n = 15), and patients with BS (n = 59), RA (n = 12), SLE (n = 22), SjS (n = 10), AAV (n = 14), PM/DM (n = 10), or SSc (n = 9).
-
BRelationship between the mtDNA levels and the presence of BS symptoms. Serum mtDNA levels were compared between BS patients with any symptoms (oral ulcer, uveitis, skin lesion, genital ulcer, arthralgia, or intestinal lesion) (n = 99) and asymptomatic (n = 83) patients.
-
CTime‐series study of the serum mtDNA levels in a BS patient. Serum mtDNA levels were compared between two visits (n = 32): Just before the onset of symptoms (Visit A) and when the patient had already presented overt symptoms (Visit B).
-
DLevels of 8‐OHdG‐modified DNA in serum. After the purification of DNA from HC (n = 16) or BS (n = 57) serum, the levels of 8‐OHdG‐modified DNA were evaluated using ELISA.
-
EmtDNA in BS serum could only be digested by DNase I when the sample had been treated with Triton X‐100. After the purification of DNA from the serum, the mtDNA levels were measured (n = 10).
-
F, GmtDNA levels in 100K‐Evs and 16K‐Evs. 100K‐Evs (F) and 16K‐Evs (G) were isolated from the serum of the same HC (n = 4), BS (n = 5), or SLE (n = 5) patients, then DNA was subsequently purified from each of them, and the mtDNA levels were measured.
-
HDeposition of dsDNA in 100K‐Evs from BS serum. 100K‐Evs isolated from BS serum after DNase I treatment were fixed and stained with an anti‐dsDNA antibody, then visualized with a secondary antibody conjugated to 10‐nm gold particles. Images were obtained using transmission immunoelectron microscopy. Black dots (white arrows) indicate dsDNA deposition. Scale bar, 100 nm.
-
ICD63 level in HC and BS serum. The levels of CD63 in HC (n = 15) and BS (n = 18) serum were evaluated by CD63‐specific ELISA.
-
JSerum mtDNA level vs. serum CD63 level. Scatter plots of serum mtDNA level measured by qPCR (Y‐axis) and serum CD63 level determined by ELISA (X‐axis) in HC (blue circle) (n = 15) and BS (red circle) (n = 18).
-
KmtDNA levels in 100K‐EVs depending on the presence or absence of BS symptoms. mtDNA levels in 100K‐EVs from symptomatic (n = 6) and asymptomatic (n = 5) BS patients were compared.
Data information: Statistical analyses were performed using a Steel–Dwass test (A, E–G) or a Mann–Whitney U test (B, D, I, K) (median; 25th and 75th percentiles; minimum and maximum value excluding outliers; *P < 0.05, **P < 0.01; NS: not statistically significant), a Wilcoxon signed‐rank test (C) (**P < 0.01), or a non‐parametric Spearman's rank test (J).
Source data are available online for this figure.