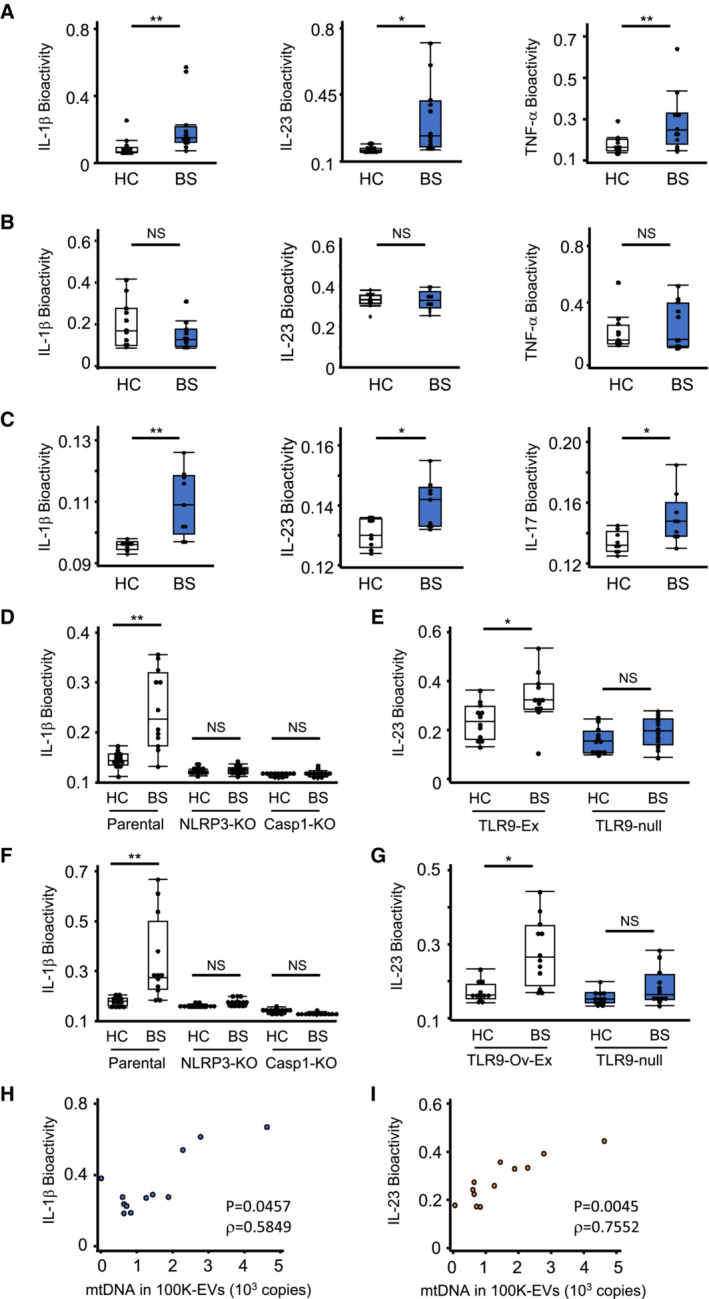
Figure 7. BS exosomes promote cytokine production via NLRP3 and TLR9.

-
A, BCytokine production by EVs. 100K‐EVs (A) or 16K‐EVs (B) isolated from HC or BS serum were added to human PBMCs. Cytokines from these PBMCs were evaluated via reporter cells for IL‐1β, IL‐23, and TNF‐α.
-
CCytokine levels in ascites via intraperitoneal injection of 100K‐EVs. After injection of 100K‐EVs isolated from HC and BS serum, the ascites levels of IL‐1β and IL‐23 at 24 h, and of IL‐17 at 72 h, were determined using reporter cells.
-
D–GmtDNA in BS 100K‐EVs induce cytokine production through NLRP3 and TLR9. 100K‐EVs isolated from HC or BS serum were added to WT, NLRP3‐KO, and Casp1‐KO‐THP‐1 cells (D) or WT (TLR9‐null) and TLR9‐Ex THP‐1 cells (E). DNA purified from HC or BS 100K‐EVs was re‐enclosed in liposomes using Avalanche‐Omni and added to WT, NLRP3‐KO, and Casp1‐KO‐THP‐1 cells (F) or WT (TLR9‐null) and TLR9‐Ex THP‐1 cells (G). After 24 h, the levels of IL‐1β (D, F) and IL‐23 (E, G) were measured using reporter cells.
-
H, ICorrelation between cytokine production and mtDNA levels in 100K‐EVs. Levels of mtDNA in 100K‐EVs and IL‐1β (H) and IL‐23 (I) production in THP‐1 cells upon liposome‐enclosed mtDNA stimulation.
Data information: Statistical analyses were performed using a Mann–Whitney U test (A–C) or a Steel–Dwass test (D–G) (median; 25th and 75th percentile; minimum and maximum value excluding population outliers; *P < 0.05, **P < 0.01; NS, not statistically significant) or a non‐parametric Spearman's rank test (H, I). Correlation coefficient (R), *P < 0.05. The data are representative of two (A–C, H, I) and three (D–G) independent experiments.
Source data are available online for this figure.
