
Figure EV1. Aurora kinase inhibition regulates transcriptional pathways that promote inflammation and immune recognition.
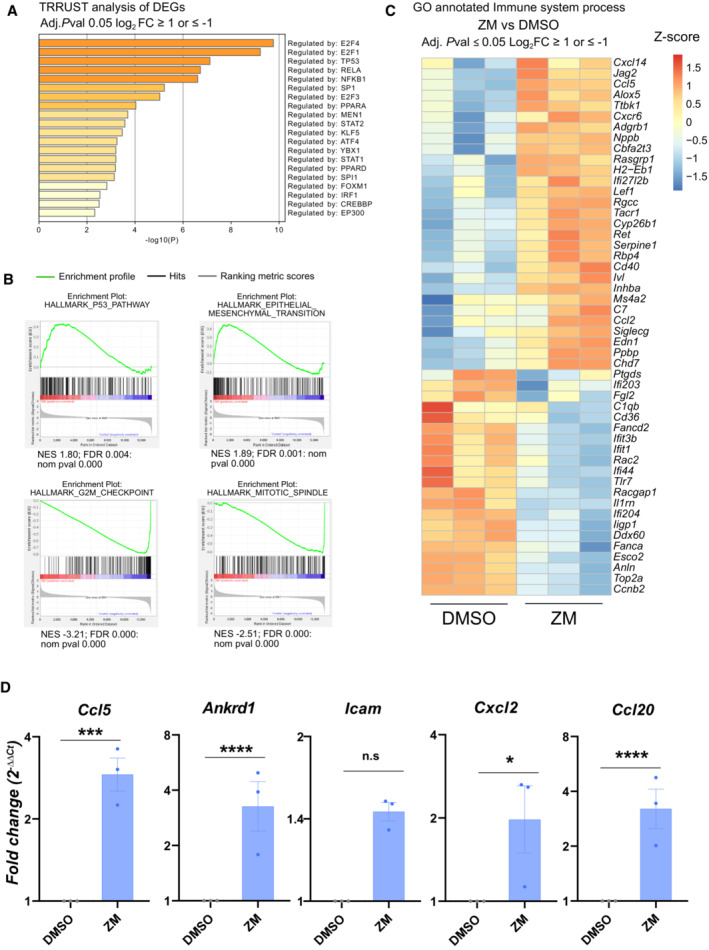
Primary MEF were treated with DMSO or Aurora kinase inhibitor (ZM, 2 μM) for 72 h, followed by RNA isolation and 3′ mRNA‐sequencing.
- TRRUST analysis of significant DEGs in ZM vs. DMSO treated cells displaying transcription factors predicted to participate in their regulation. Adjusted P ≤ 0.05 and cut‐off values log2 FC ≥ 1 or log2 FC ≤ −1.
- Gene set enrichment analysis (GSEA) analysis of transcripts differentially regulated between ZM and DMSO treatment.
- Curated heatmap for significant DEGs involved in the GO‐term “immune system process” (GO: 0002376) that are enriched in ZM vs. DMSO treated MEF. Adjusted P ≤ 0.05 and cut‐off values log2 FC ≥ 1 or log2 FC ≤ −1.
- qRT‐PCR analysis of selected pro‐inflammatory cytokines and chemokines induced in ZM‐treated MEF, plotted as fold‐change expression relative to untreated cells. Hprt1, β‐actin and Gapdh were used as house‐keeping gene expression controls. n = 3 biological replicates; data represent mean values ± SEM. The statistical significance was determined using two‐tailed t‐test; P ≤ 0. 1 (*), P ≤ 0.01 (**), P ≤ 0.001 (***), P ≤ 0.0001 (****).