
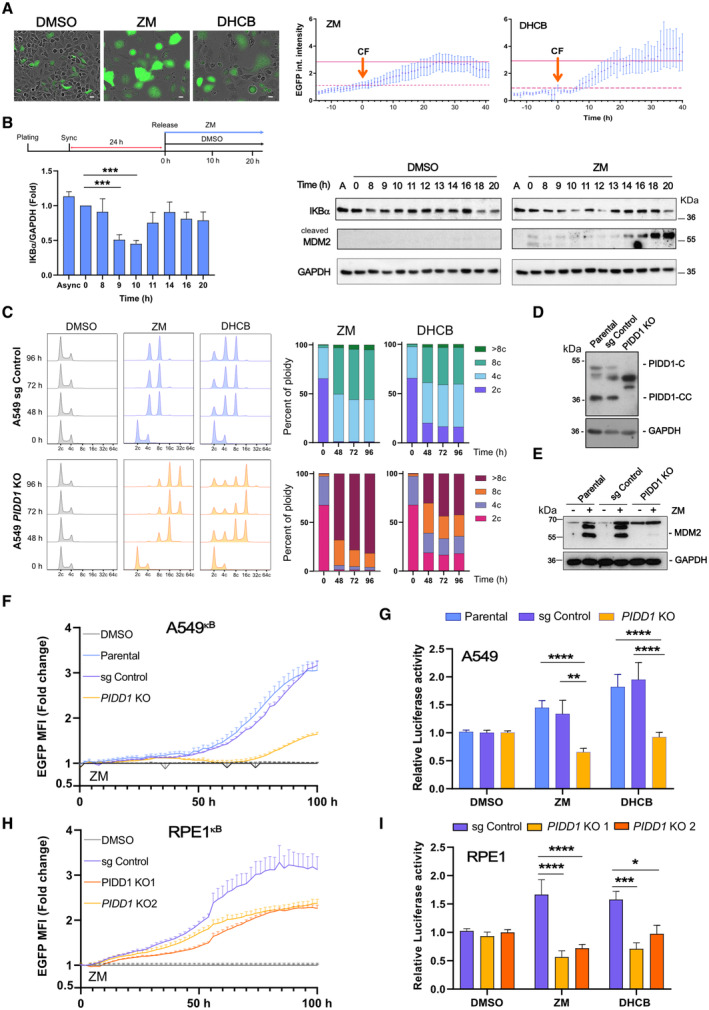
Figure 2. Cytokinesis failure induces NF‐κB activation via PIDD1.
-
ATime‐lapse analysis of NF‐κB‐driven EGFP reporter activity in A549kB cells where cytokinesis failure was induced by treatment with ZM (2 μM) or DHCB (4 μM). Single cells were imaged every 20 min using IncuCyte life cell imaging technology. Left, representative images of A549kB cells 48 h after starting the treatment. Scale bars: 10 μm. See also Movies [Link], [Link]. Right, EGFP integrated fluorescence intensity of individually tracked cells was measured over time. Time zero was determined as the moment of cytokinesis failure (CF) of each individual cell analyzed. Dashed lines indicate the integrated EGFP intensity of the cells at time zero that was used to calculate the fold‐change over time. Solid lines indicate the mean EGFP integrated fluorescence intensity of the cells 24 h after failing cytokinesis. An n ≥ 10 cells per condition were followed individually in a single experiment, data points represent means ± SEM.
-
BTop, experimental design. Left, densitometric analysis of IKBα protein levels in synchronized A549 cells detected over time after release. Bars represent ZM values normalized with respect to DMSO. n = 3 independent experiments, data represent mean values ± SEM. Right, time course immunoblot analysis of synchronized A549 cells, released in DMSO or ZM (2 μM).
-
CFlow cytometric analysis of DNA content in A549 cells after induction of cytokinesis failure with ZM (2 μM) or DHCB (4 μM) over time. Two independent experiments were performed.
-
D, E(D) Western blot analysis confirming lack of PIDD1 expression in A549 cells and (E) MDM2 processing after induction of cytokinesis failure using ZM (2 μM) for 48 h.
-
FLive‐cell imaging analysis of NF‐κB EGFP‐reporter activity in CRISPR‐edited polyclonal A549κB cells. NF‐κB activity of ZM‐treated cells is represented as fold‐change with respect to their untreated counterparts (DMSO‐treated cells, gray lines). n = 5 independent experiments. Error bars represent ± SEM.
-
GLuciferase‐based reporter assay of NF‐κB activity in CRISPR‐edited polyclonal PIDD1‐competent or –deficient A549 cells. Cells were transfected with a firefly 2x(κB)‐luciferase reporter and treated with ZM (2 μM) or DHCB (4 μM) for 48 h to induce cytokinesis failure. Luciferase activity was normalized respective a co‐transfected renilla control. n ≥ 3 experiments, bars represent means ± SEM.
-
HLive‐cell imaging analysis of NF‐κB EGFP‐reporter activity in CRISPR‐edited polyclonal RPE1kB cells analyzed as in as in F.
-
IAnalysis of CRISPR‐edited polyclonal PIDD1‐competent or deficient RPE1 cells, analyzed for luciferase reporter activity as in G. n ≥ 5 experiments; bars represent mean values ± SEM.
Data information: The statistical significance was determined using two‐way ANOVA; P ≤ 0. 1 (*), P ≤ 0.001 (***), P ≤ 0.0001 (****).
Source data are available online for this figure.