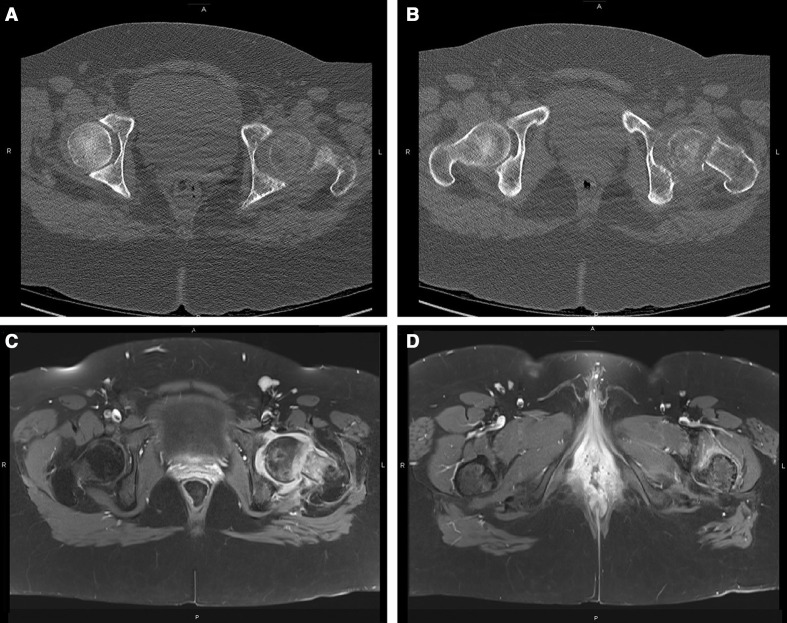
Figure 2.
Axial CT scan demonstrating left hip osteopaenia with femoral head and neck hypodensity and neck fracture (A,B). Axial MRI T1 FAT SAT sequences with gadolinium contrast injection showing a hyposignal on the left femoral head with bone marrow oedema and joint effusion (C) as well as normalisation of the signal distally (D).

