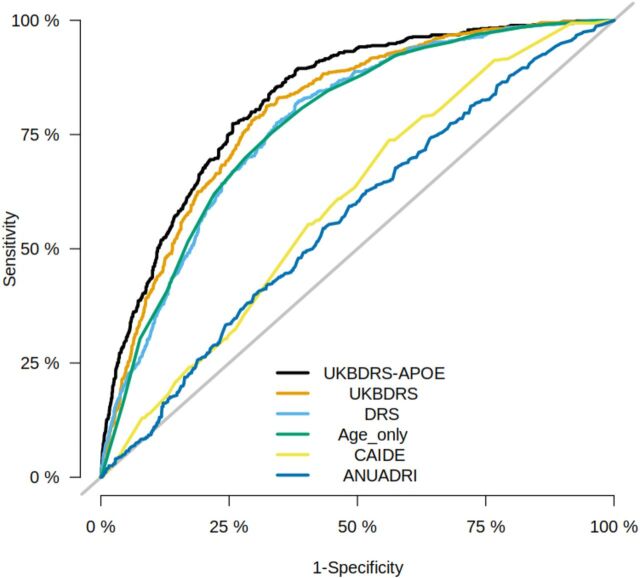
Figure 1.
Receiver-operating characteristic curves (ROC) for each risk score in the UKB test set. Sensitivity and specificity (plotted from 1 to 0) at varying thresholds to build and ROC curve for each risk score computed in the UKB test set. The highest performing score, as indicated by the greatest area under the curve, was the UKBDRS-APOE model, followed by the UKBDRS, age only, DRS, CAIDE, and ANU-ADRI. The UKBDRS-APOE performance is assessed in the subset of individuals with genotype information available. ANU-ADRI, Australian National University Alzheimer’s Disease Risk Index; CAIDE, Cardiovascular Risk Factors, Aging and Dementia; DRS, Dementia Risk Score; UKB, UK Biobank; UKBDRS, UK Biobank Dementia Risk Score; WHII, Whitehall II.

