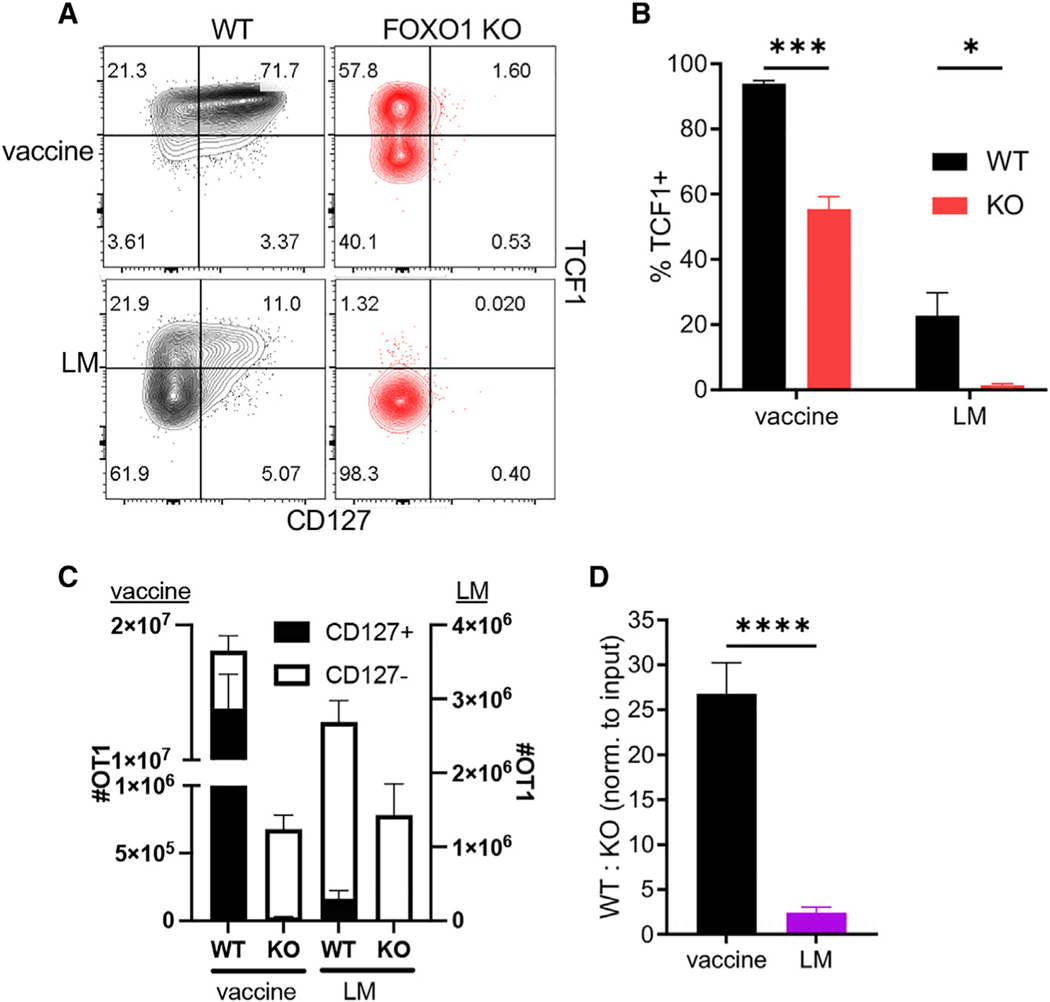
Figure 3. Tvacs require FOXO1 for peak and memory responses.
WT and FOXO1 KO OT1 cells were co-transferred into WT C57BL/6 recipients that were then vaccinated or challenged with LM-OVA. On day 7 post challenge, the splenic WT and KO OT1 phenotype was analyzed by flow cytometry.
(A) Representative contour plots for CD127 versus TCF1 staining.
(B) Representative contour plots for TCF1 versus FOXO1 staining.
(C) The number of total WT and KO OT1 cells split into CD127+ and CD127− subsets.
(D) The number of WT cells divided by the number of KO cells normalized to input.
(E) The percentage of TCF1+ in WT and KO OT1 cells.
Data shown are mean ± SEM; n ≥ 4 mice per group, representative of two experiments. Significance was defined by unpaired t test with Welch’s correction and two-way ANOVA, where *p < 0.05, **p < 0.01, ***p < 0.001, ****p < 0.0001.

