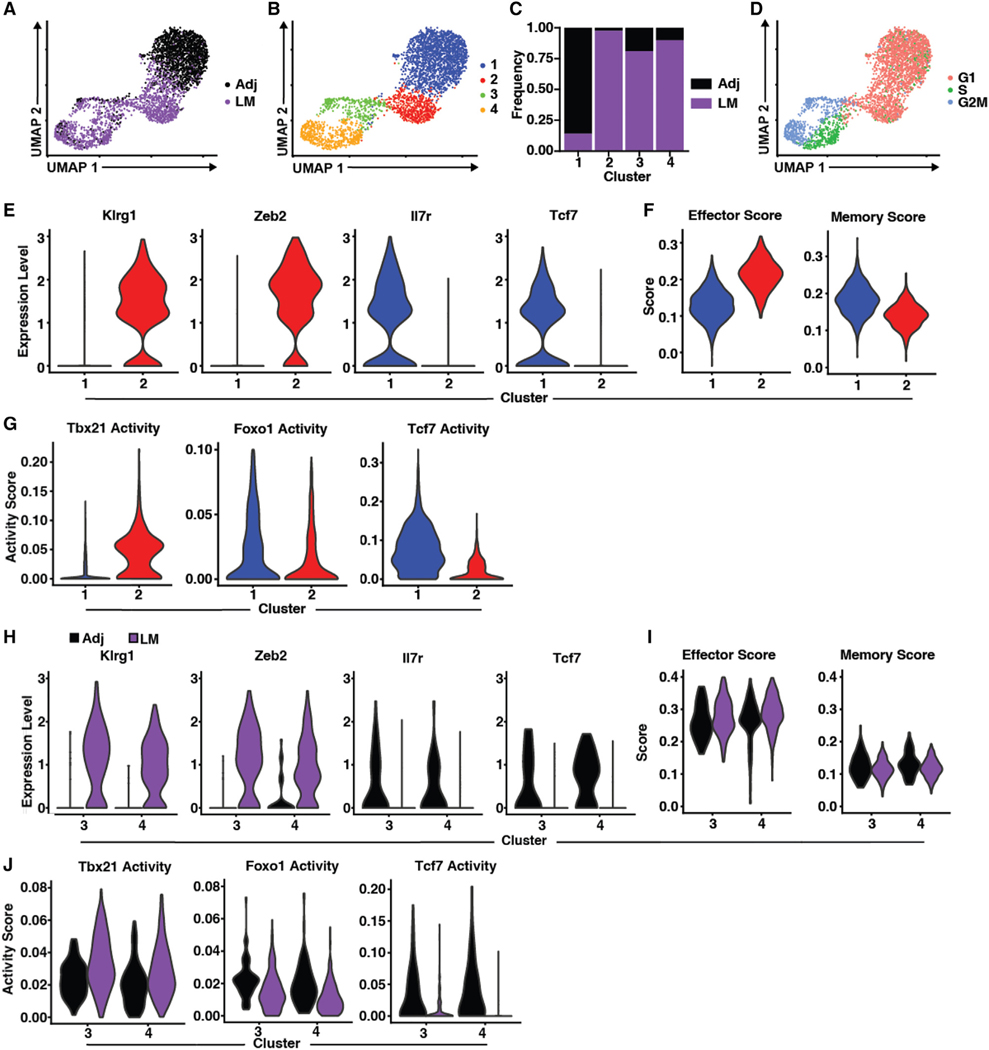
Figure 6. Adjuvant-elicited T cells express dual effector and memory transcriptional programs.
(A) Uniform Manifold Approximation and Projection (UMAP) Dimensionality reduction mapping analysis of single-cell gene expression data of OT1 cells isolated 7 days post infection with LM-OVA (LM, purple) or adjuvanted OVA vaccine (Adj, black).
(B) UMAP as in (A), with cells color coded by clusters derived from shared nearest neighbor analysis.
(C) Proportion of either Adj- or LM-elicited T cells within clusters depicted in (B).
(D) UMAP as in (A), with cells color coded by cell cycle status inferred from transcriptional profiles.
(E) Violin plots depicting expression of select genes associated with either the effector (left) or memory (right) phenotype within clusters 1 and 2.
(F) Violin plots depicting the module score of gene sets associated with effector (left) or memory (right) within clusters 1 and 2.
(G) Violin plots of SCENIC-inferred transcription factor activity within clusters 1 and 2.
(H) Violin plots depicting expression of select genes associated with either the effector (Klrg1 and Zeb2) or memory (Il7r and Tcf7) phenotype of Adj- or LM-elicited cells within clusters 3 and 4.
(I) Violin plots depicting the module score of gene sets associated with effector (left) or memory (right) of Adj or LM cells within clusters 3 and 4.
(J) Violin plots of SCENIC-inferred transcription factor activity of Adj- or LM-elicited cells within clusters 3 and 4.

