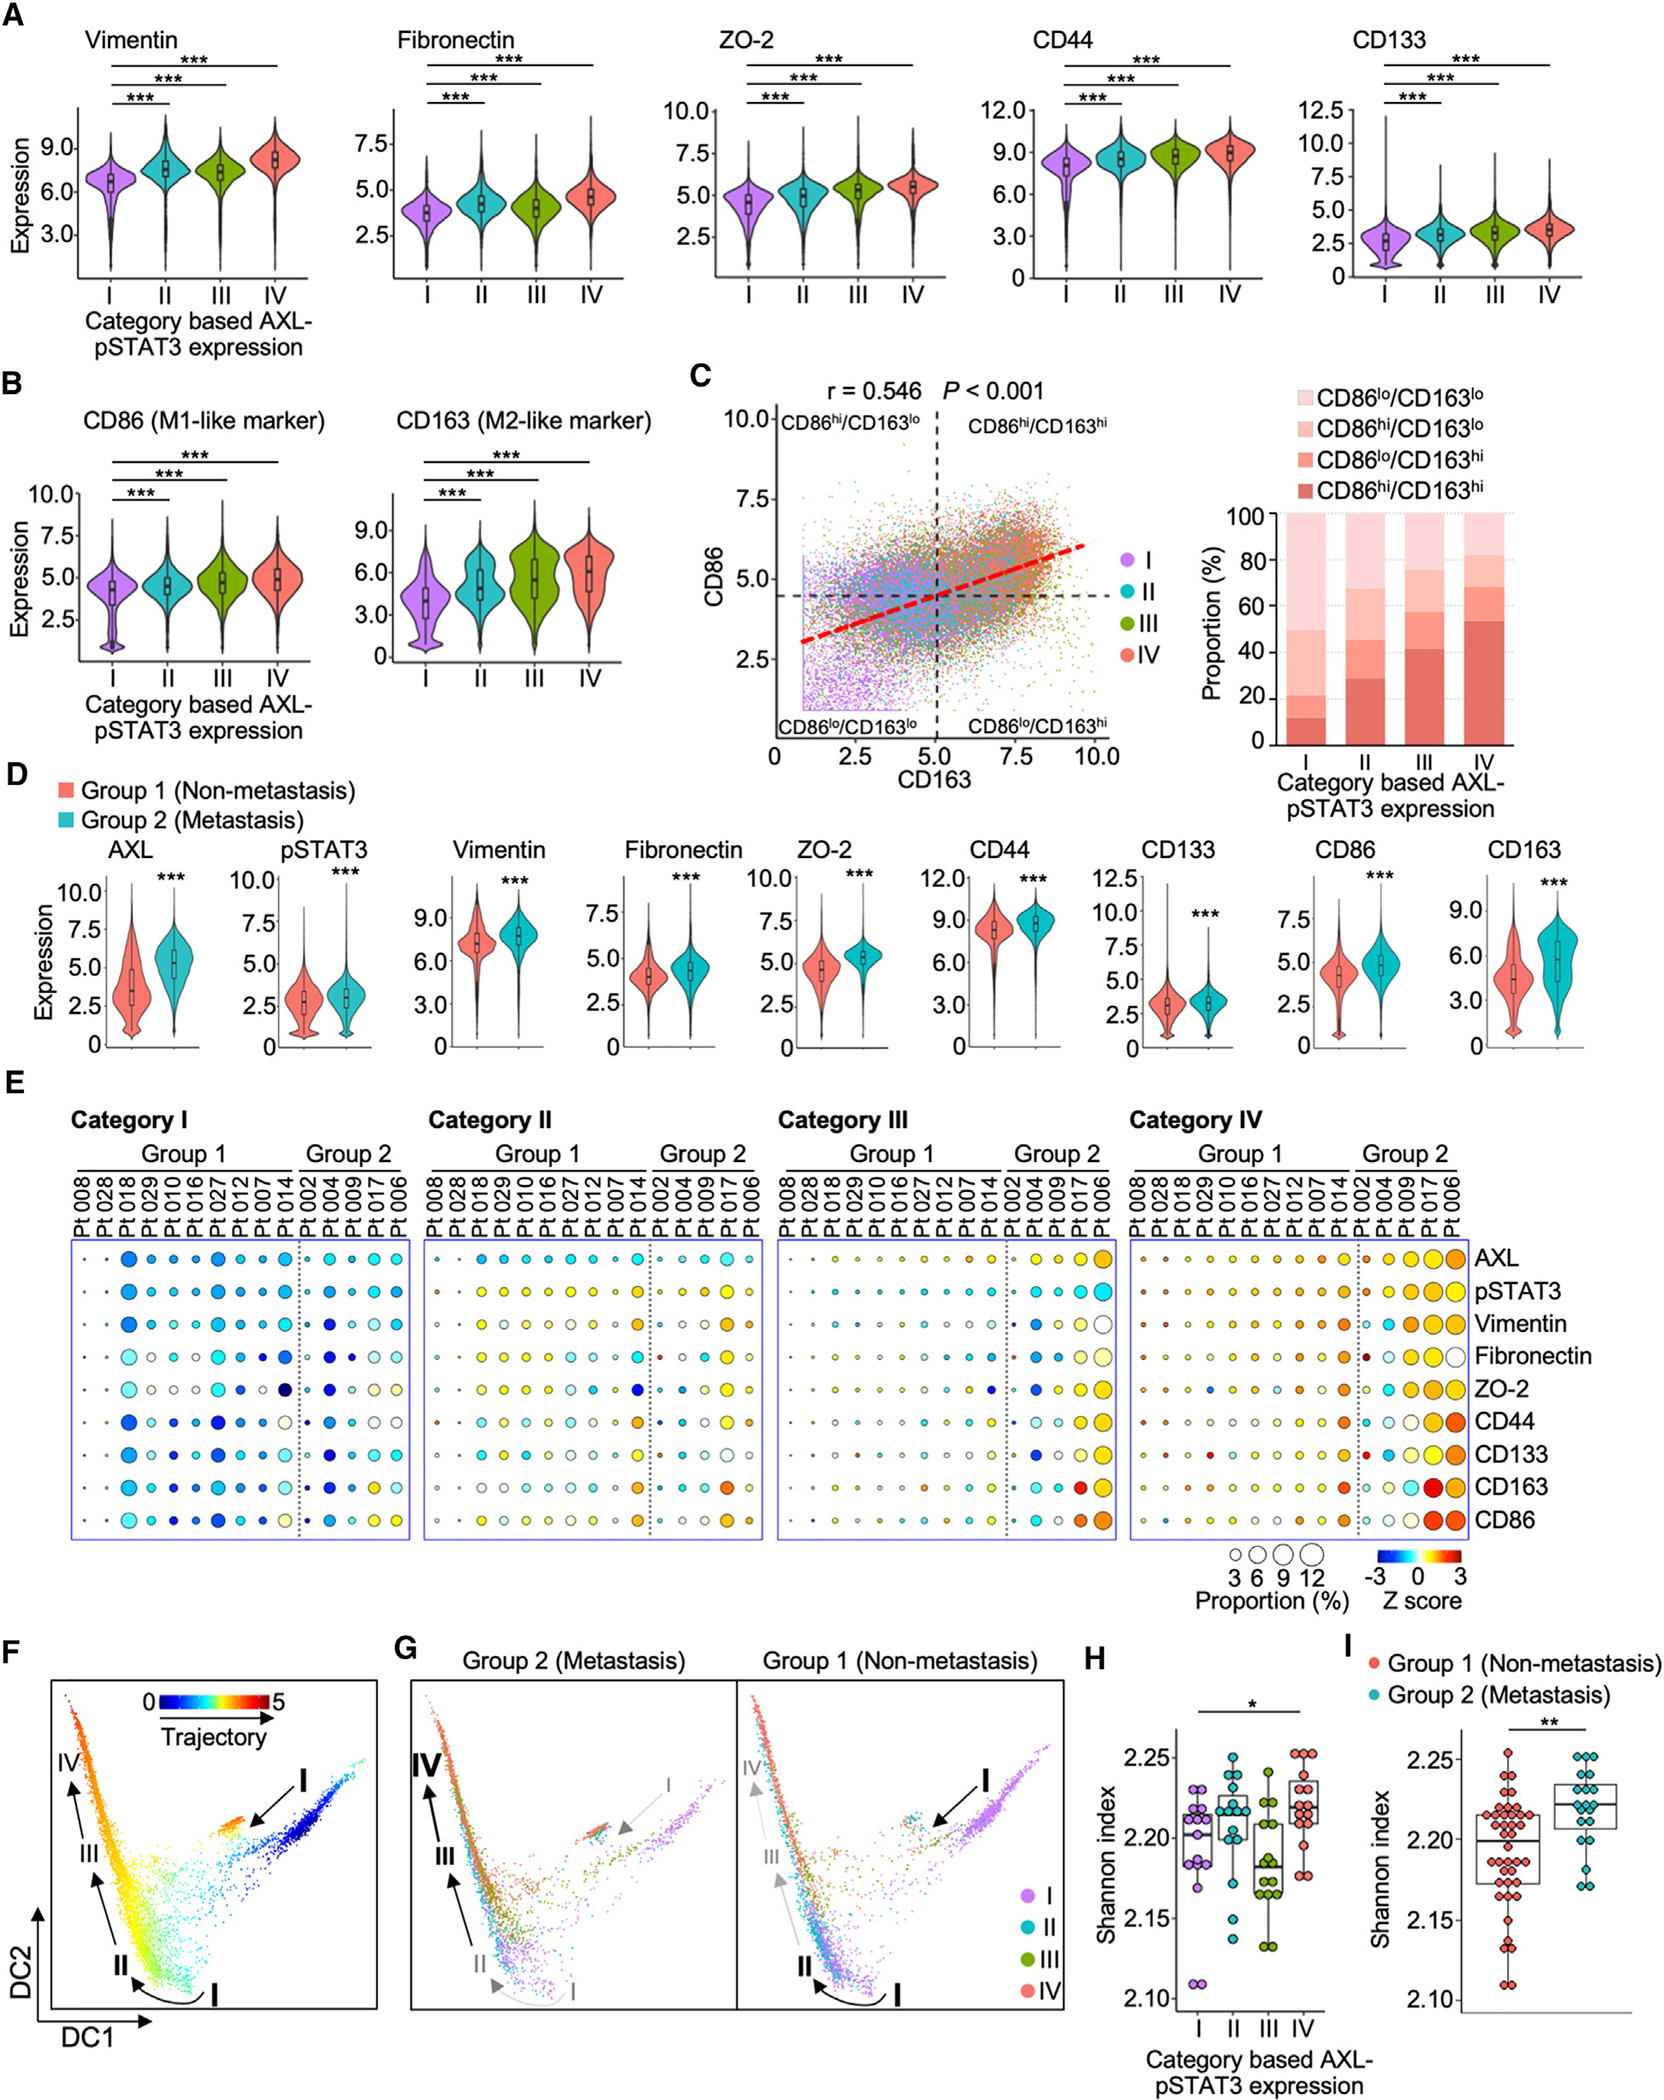
Figure 2. Concordant AXL-STAT3 enhances pro-tumoral features of macrophages.

(A and B) Violin plots reveal expression levels of five EMT/stemness and two polarization markers of macrophages in the four AXL-pSTAT3 categories in lung TMEs. Data are mean ± SD; ***p < 0.001; one-way ANOVA followed by Duncan’s multiple range tests.
(C) CD86 and CD163 correlation scatterplot of macrophages demonstrates the four subtypes based on mean values of CD86 and CD163 and bar graph of the subtype proportions in the four AXL-pSTAT3 categories.
(D) Violin plots of expression levels of the seven markers in group 1 and 2 tumors. Data are mean ± SD; ***p < 0.001; Student’s t test.
(E) Circle plots showing the proportions and expression levels of AXL, pSTAT3, and the seven markers of the four AXL-pSTAT3 categories in individual tumors from group 1 and 2 patients.
(F and G) Diffusion maps of the pseudotime trajectories of the overall macrophages and macrophages from group 1 or 2 tumors of the four AXL-pSTAT3 categories. The arrows indicate the trajectory.
(H) Boxplot of Shannon indices in the four AXL-pSTAT3 categories (n = 15 for each category). Data are mean ± SD; *p < 0.05; one-way ANOVA followed by Duncan’s multiple range tests.
(I) Boxplot of Shannon indices in group 1 (n = 40) and 2 (n = 20) tumors. Data are mean ± SD; **p < 0.01; Student’s t test.
