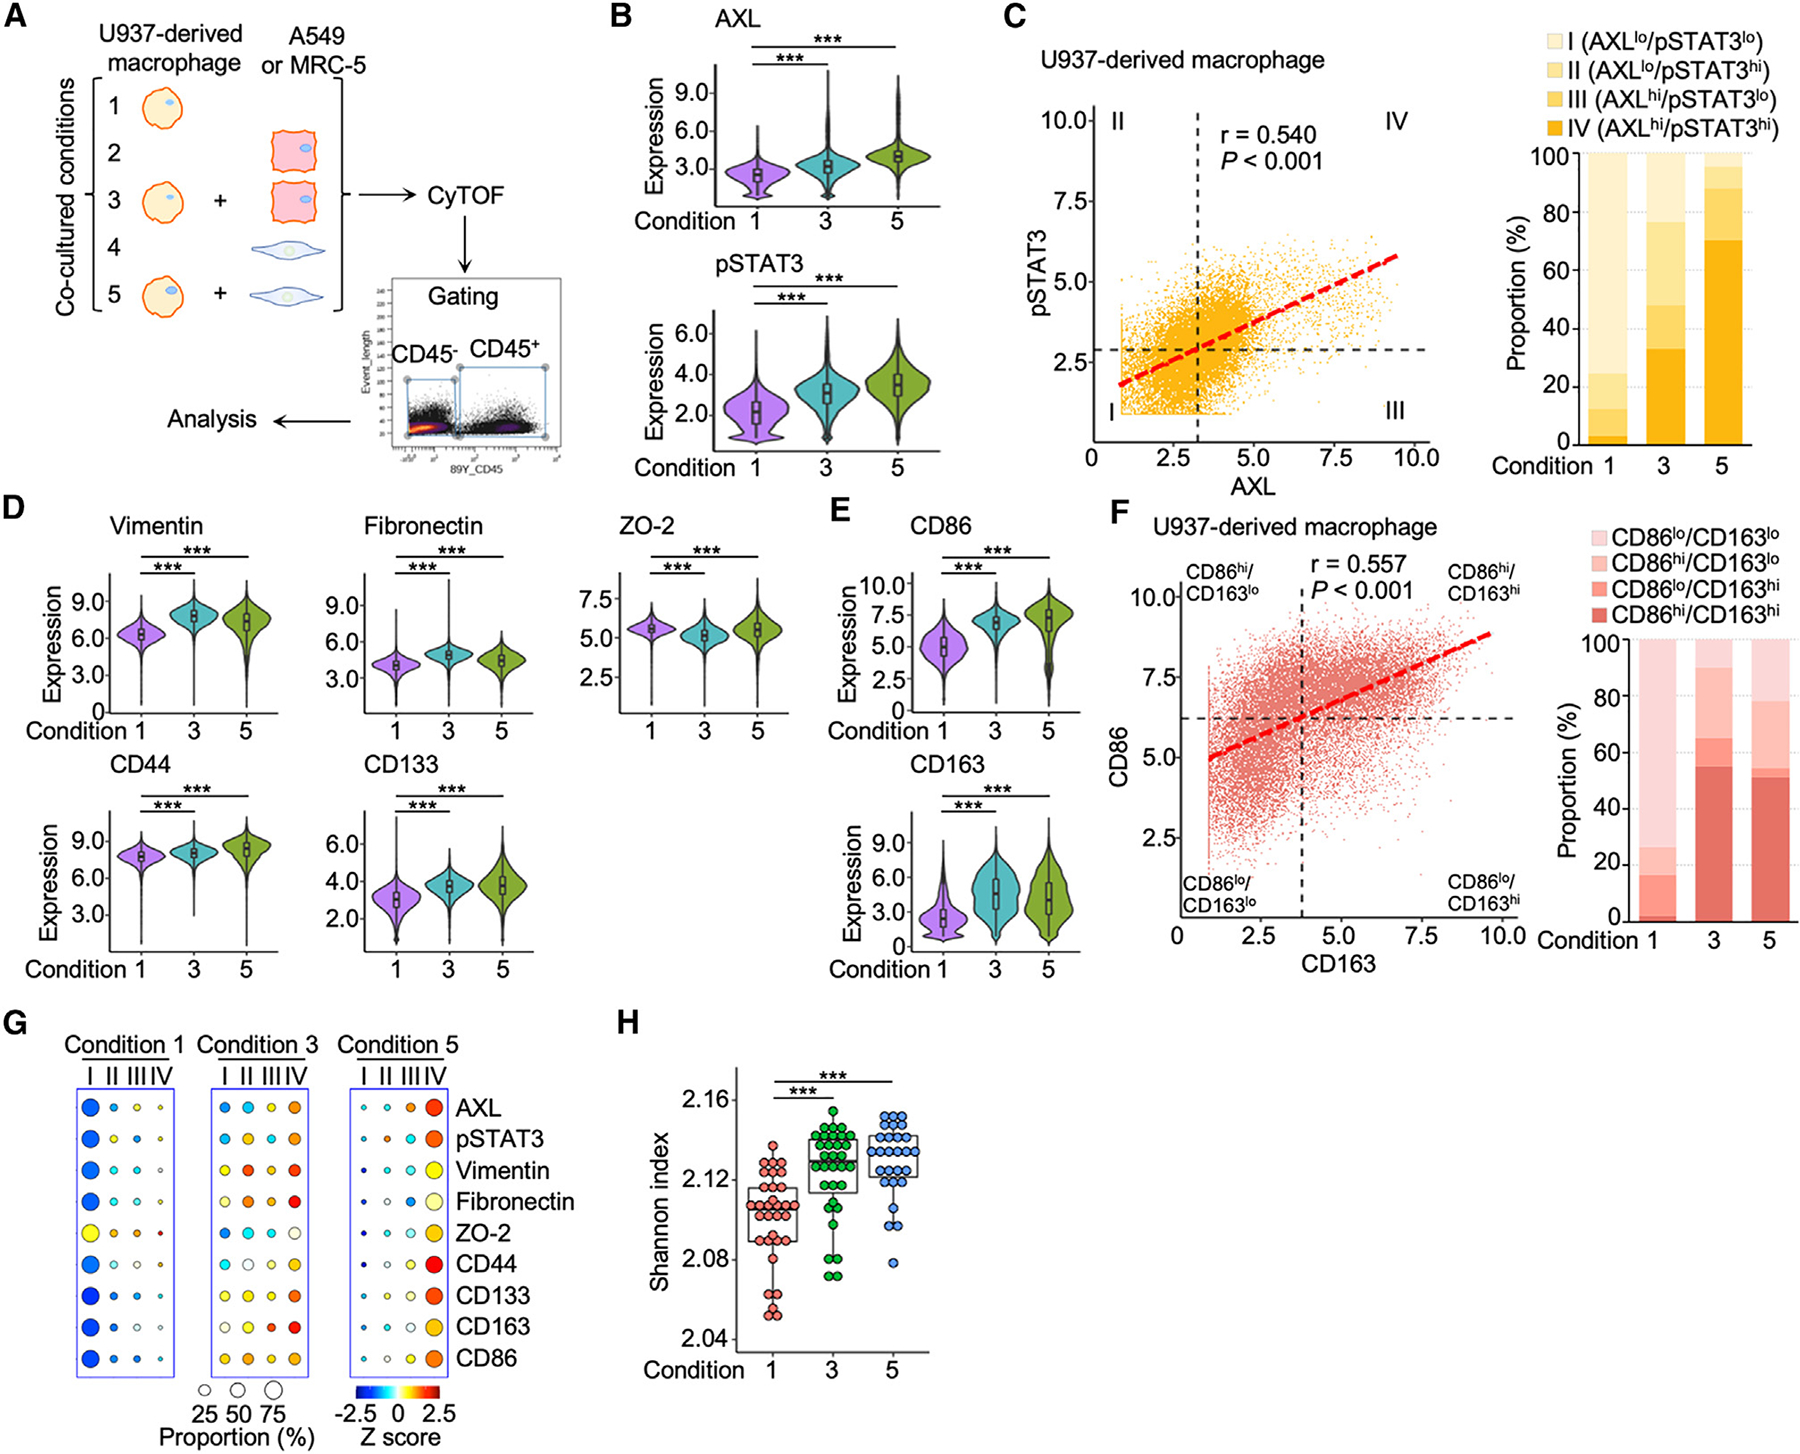
Figure 3. Paracrine activation of AXL-STAT3 in macrophages exposed to lung cancer cells or cancer-associated fibroblasts.

(A) Co-cultured conditions of U937-derived macrophages and A549 lung cancer cells or MRC-5 lung fibroblasts with cytometry by time-of-flight (CyTOF) workflow.
(B) Violin plots showing the expression levels of AXL and pSTAT3 of macrophages in condition 1, 3, and 5. Data are mean ± SD; ***p < 0.001; one-way ANOVA followed by Duncan’s multiple range tests.
(C) AXL and pSTAT3 correlation scatterplot of macrophages showing the four categories based on mean values of AXL and pSTAT3 and bar graph of category proportions in condition 1, 3, and 5.
(D and E) Violin plots of expression levels of the seven AXL-pSTAT3-related markers in macrophages of condition 1, 3, and 5. Data are mean ± SD; ***p < 0.001; one-way ANOVA followed by Duncan’s multiple range tests.
(F) CD86 and CD163 correlation scatterplot of macrophages showing the four subtypes based on mean values of CD86 and CD163 and bar graph of subtype proportions in condition 1, 3, and 5.
(G) Circle plots showing the proportions and expression levels of AXL, pSTAT3, and the seven markers of the four AXL-pSTAT3 categories in condition 1, 3, and 5.
(H) Boxplot of Shannon indices in condition 1, 3, and 5 of 32 PhenoGraph clusters (n = 32). Data are mean ± SD; ***p < 0.001; one-way ANOVA followed by Duncan’s multiple range tests.
