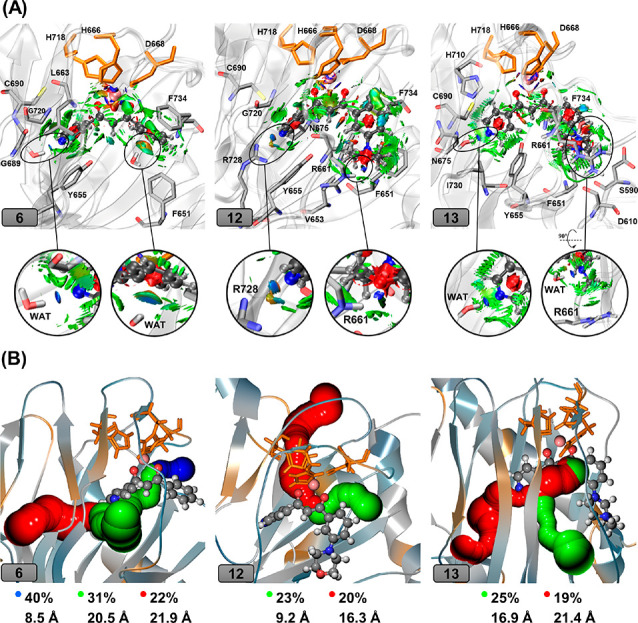
Figure 4.

(A) The plot of the noncovalent interactions between compounds 6, 12, and 13 and the surrounding amino acid residues. The inhibitors are given in ball-and-sticks, and Fe(II) is shown in pink sphere. Residues forming noncovalent interactions with the inhibitor are shown in sticks. Red surfaces are related to repulsive interactions, while green surfaces denote weak interactions like van der Waals, and blue ones show strong attractive interactions such as hydrogen bonds. (B) O2-transporting tunnels with largest calculated percentages along the trajectory observed in compounds 6, 12, and 13. Calculated tunnels are colored in blue, green, and red, respectively, based on the tunnel’s length (Å) (blue: shortest, red: longest).
