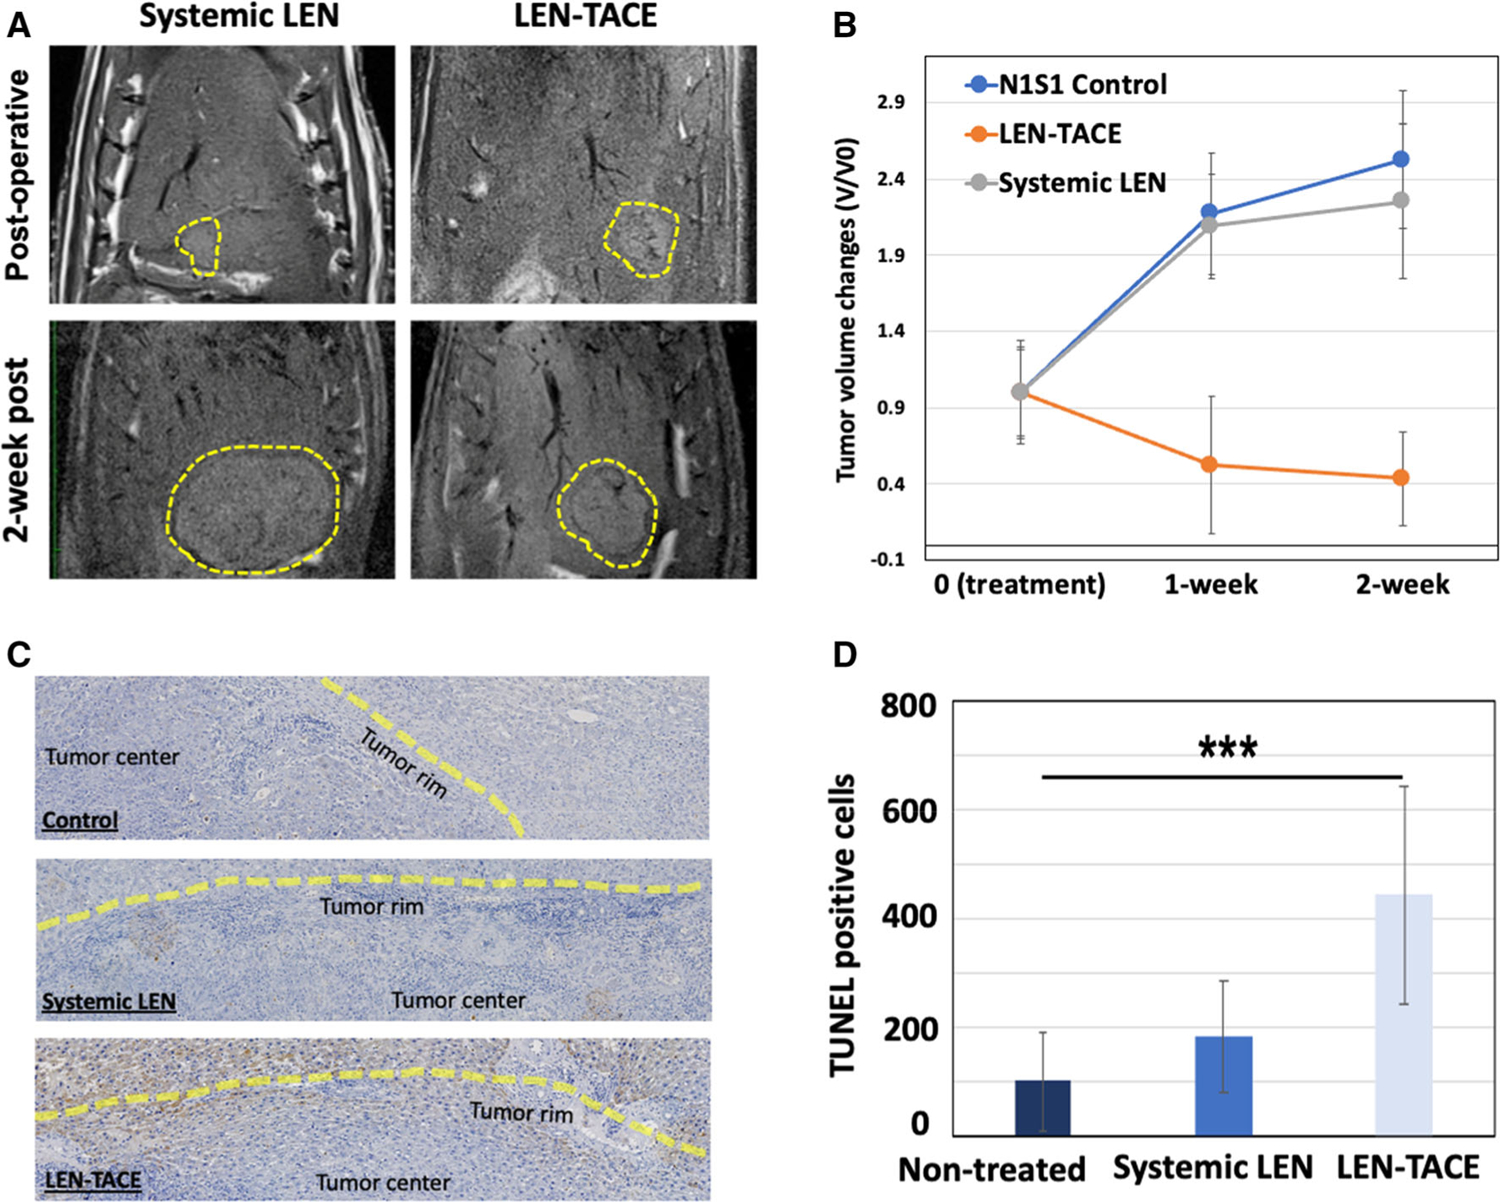
Fig. 3.

A MR T2-weighted images of HCC rats treated with control, LEN-TACE, and systemic LEN treatment. Yellow dotted outlines in MR images indicate tumors at 1 h and 3 weeks post treatment. B Tumor growth graph shows the regression of tumor volume after LEN-TACE (5 rats per group, three treatment groups: ***p < 0.001). C Immunohistochemical analyses of tumor tissue after 3 weeks of LEN-TACE treatments. Tumor tissue specimens stained with TUNEL. The brown color on slide section images indicates TUNEL-positive apoptotic cells (scale bar, 25 mm). Yellow lines are corresponding to the tumor rim region. D Quantitative analysis of TUNEL-positive apoptotic cells in 1 cm2 (***P < 0.001)
