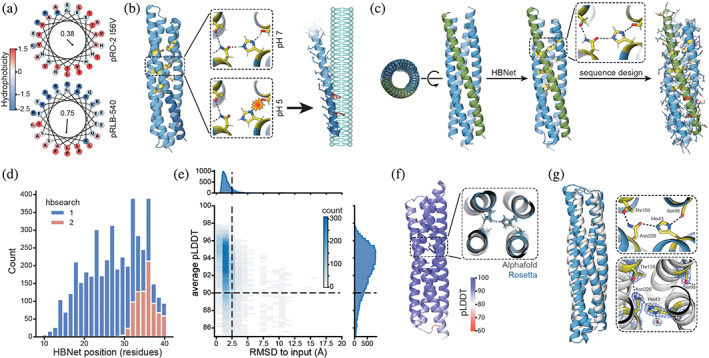
FIGURE 1.

Design strategy and computational results. (a) Wheel projections of the C‐terminal helices from pH‐responsive bundles‐2 (pRO‐2) I56V (Boyken et al., 2019) (top, previous work) and pH‐responsive lytic bundles (pRLB)‐540 (bottom, this work) with amino acids colored by their hydrophobicity (Eisenberg et al., 1984). Hydrophobic moment is shown in the center of the respective wheel. Arrow represents the magnitude and direction of the hydrophobic moment. (b) Protonation of the buried histidine residue in the pH‐responsive hydrogen bond networks (yellow) separates the individual helices from each other and exposes amphipathic helices. The C‐terminal region (dark blue) carries phenylalanines (red), which increase membrane interaction. Exposed amphipathic helices insert into phospho bilayer membranes, inducing curvature or solubilizing membrane particles in a detergent‐like manner. (c) Design strategy: starting from a library of parametrically defined four helix bundles, pH‐responsive hydrogen bond networks (yellow) were positioned in the core of the bundle using the HBNet mover. Individual helices of bundles containing two to three pH‐responsive hydrogen bond networks were looped and the remaining sequence was designed while conserving the network residues. Phenylalanines (red) were enriched in the C‐terminal helix (green). (d) Position of the hydrogen bond networks. Distance is measured in residues from the N‐terminus to the first residue participating in the hydrogen bond network. Searching for buried hydrogen bond networks over the entire length of the bundle (1) and only the top part, opposite to N‐ and C‐terminus of the bundle (2). (e) Designed structures are confidently‐predicted by AlphaFold2 (AF2) and are in close agreement with the Rosetta design model (root‐mean‐square deviation [RMSD] to input). Dashed lines indicate cutoffs used for selecting designs for experimental testing (nota bene outliers not shown). (f) AF2 predictions showed structures with the hydrogen bond networks matching the design models, and with high confidence in rotameric positions of residues participating in the hydrogen bond networks. (g) Crystal structure (Protein Data Bank 8GL3, white) and design model (blue). The zoom in views show design model (top, blue) and experimentally determined hydrogen bond networks (bottom, white). Electron density is shown as a blue mesh for the experimentally determined structure (bottom).
