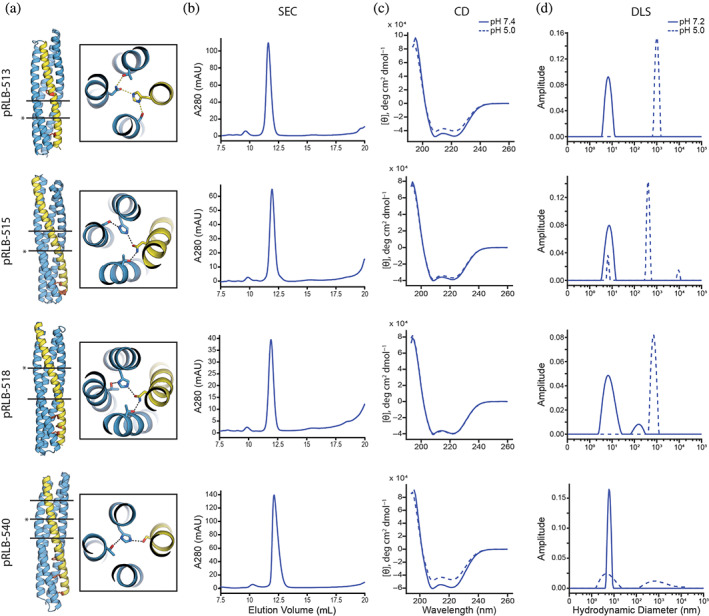
FIGURE 2.

Experimental characterization of designed proteins. (a) Model of the four designs 513, 515, 518, and 540 with zoom in views showing the indicated (*) pH‐responsive hydrogen bond network. Black lines represent hydrogen bond network layers. The C‐terminal helix (yellow) carries phenylalanines for membrane disruption (red). Size exclusion chromatography chromatogram (A280 = absorbance at 280 nm, AU = arbitrary units) (b), circular dichroism (CD) spectra (c), and dynamic light scattering (DLS) results (d) of the four proteins are shown. CD spectra and DLS data were collected at close to neutral pH and pH 5 (see Section 4 for details).
