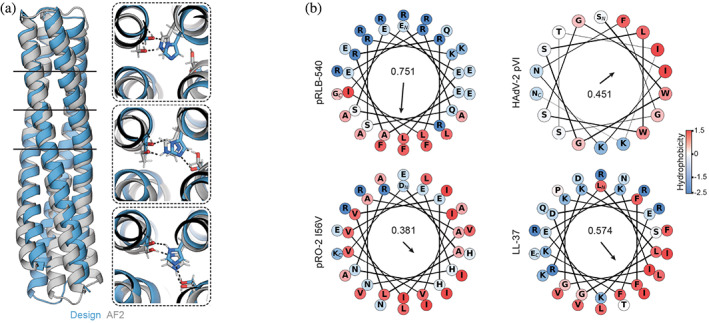
FIGURE 4.

Structure analysis. (a) Comparison of pRLB‐540 design model to AF2 structure prediction. Boxes show details of the designed hydrogen bond networks. Black lines indicate the positions of these hydrogen bond networks in the bundle. (b) Comparison of amphipathic helices of pRLB‐540 and pH‐responsive bundles‐2 (pRO‐2) I56V to LL‐37 and pVI of human adenovirus 2 (HAdV‐2). The arrow represents the amphipathic moment of the helix, highlighting that design pRLB‐540 has a stronger moment than previously designed pRO‐2.
