
Figure 2.
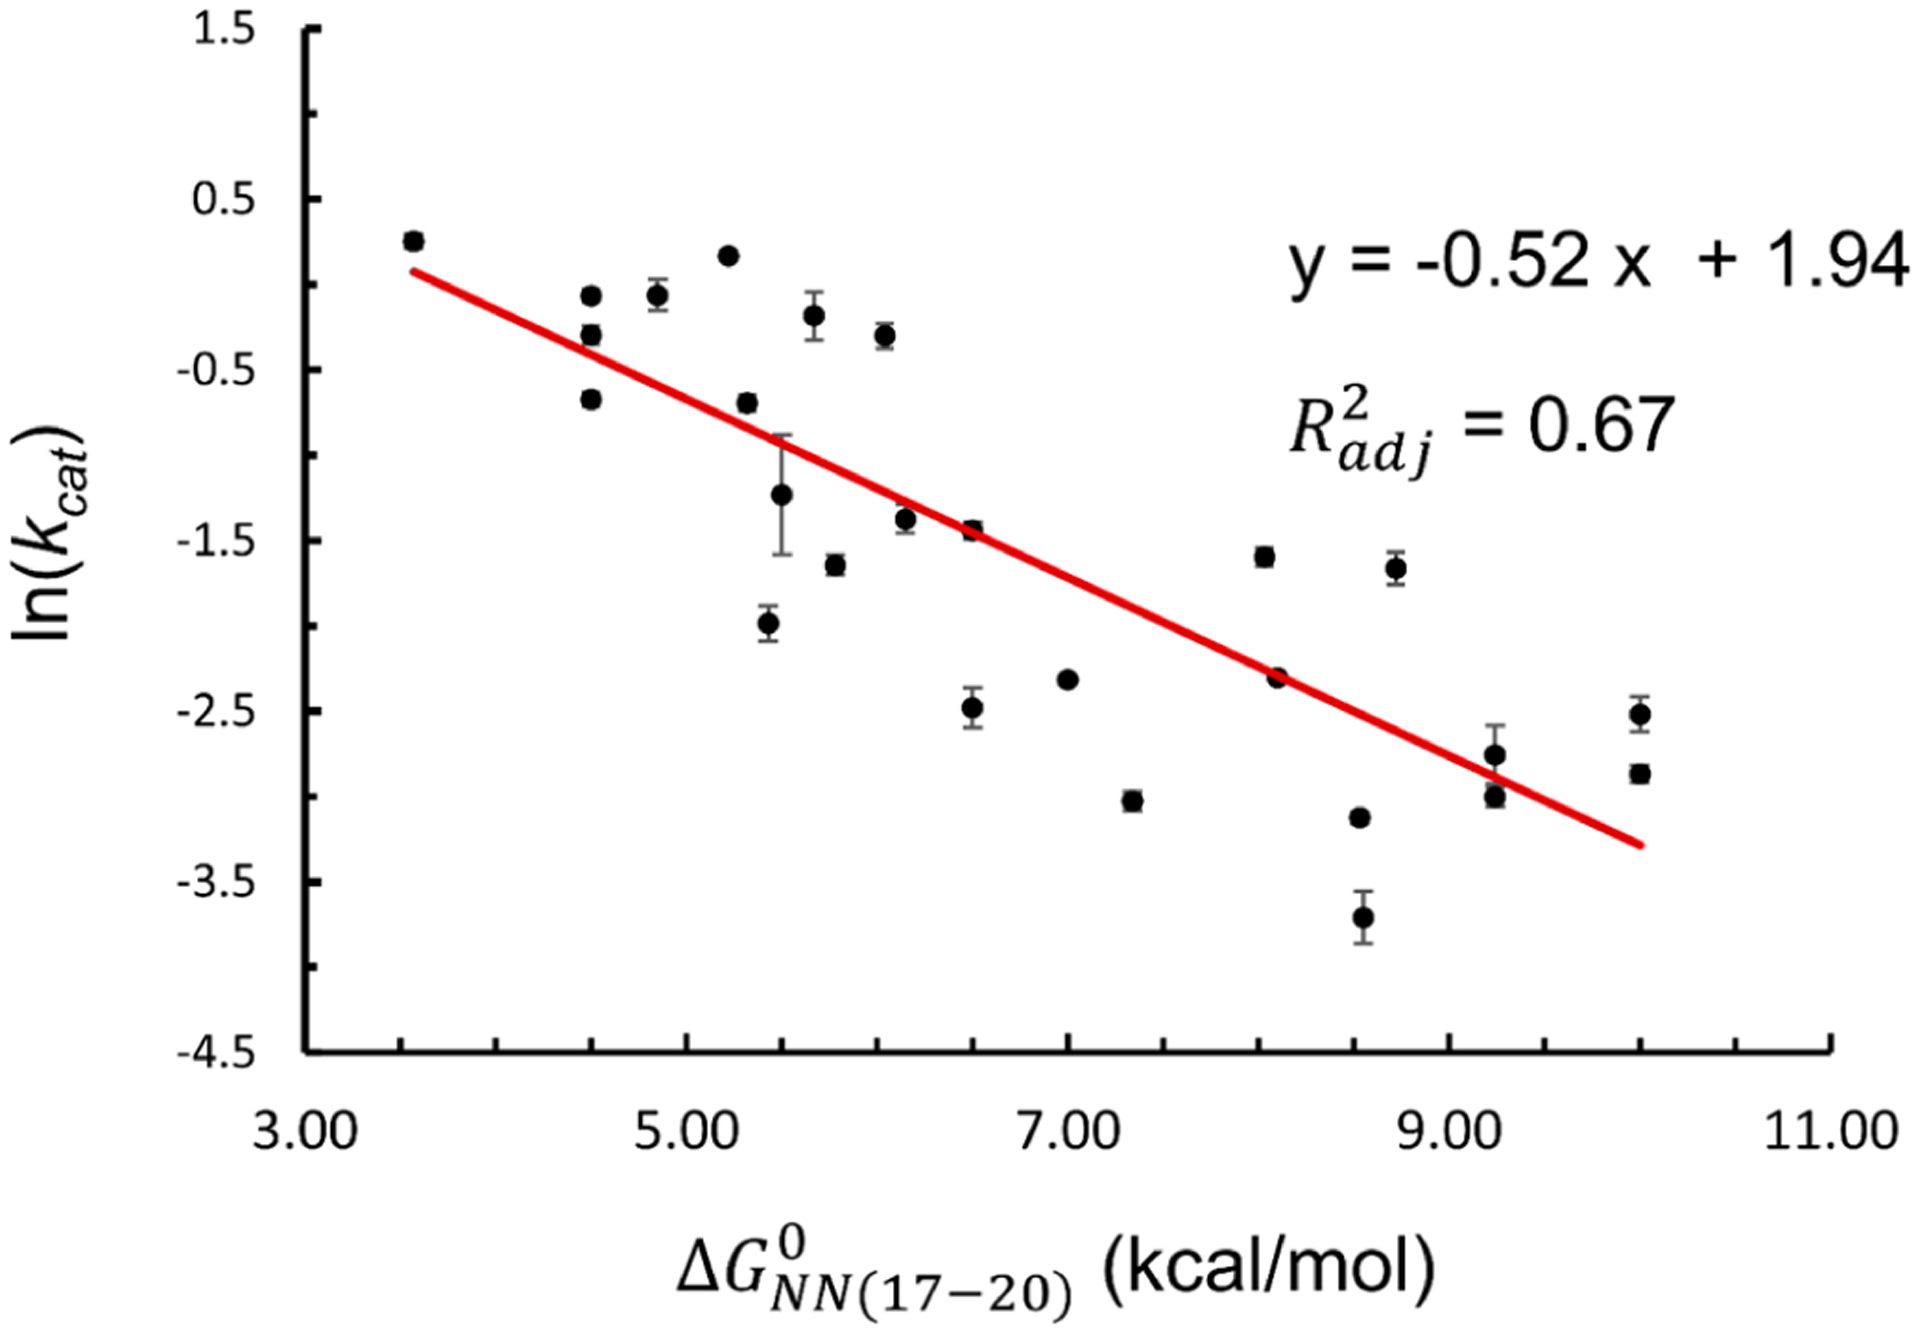
Linear regression analysis of vs . Black dots represent data obtained on the 26 substrates, and the red line represents the best linear fit. See Table S2 for further information.
Official websites use .gov
A
.gov website belongs to an official
government organization in the United States.
Secure .gov websites use HTTPS
A lock (
) or https:// means you've safely
connected to the .gov website. Share sensitive
information only on official, secure websites.
Linear regression analysis of vs . Black dots represent data obtained on the 26 substrates, and the red line represents the best linear fit. See Table S2 for further information.