
Fig. 3.
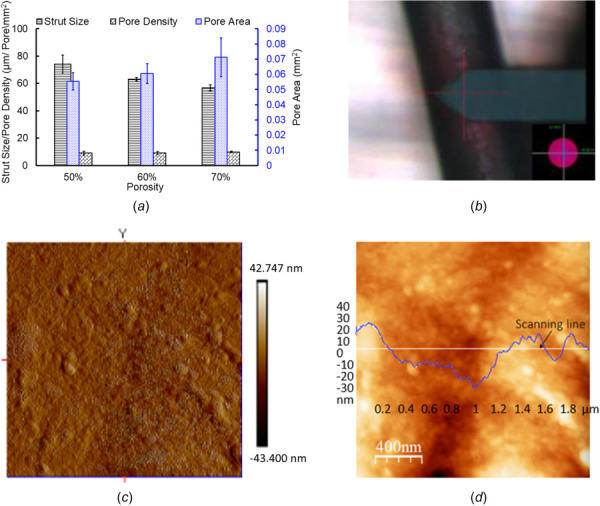
PCL FD properties and surface characterization (a) strut thickness, pore sizes, and pore densities. The error bars are shown as ±1σ standard deviation except for the pore areas, where error bars are shown for 1 standard mean error (SEM), (b) optical image showing atomic force microscopy (AFM) probe tip position on a PCL strut on the flow diverter with 40× magnification, (c) AFM 3D surface topography of strut surface, and (d) variation of surface roughness along the scanning line. The RMS value of surface roughness is 14.45 nm.