. 2023 Aug 8;145(11):111005. doi: 10.1115/1.4062937

Fig. 10.

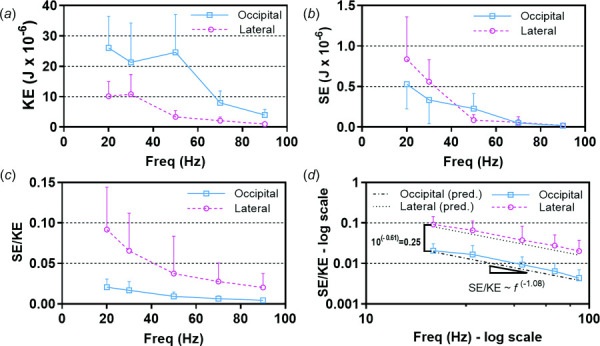
(a) Kinetic energy (KE) and (b) strain energy (SE) computed for each participant for occipital excitation and lateral excitation. (c) SE/KE ratio on a linear scale and (d) SE/KE ratio on a log–log scale. Dashed lines show predicted SE/KE with best-fit model parameters: bLat=0.295, bOcc=−0.309, and m=−1.08. In all panels, values are mean for 16 participants and error bars indicate plus or minus one standard deviation.

(a) Kinetic energy (KE) and (b) strain energy (SE) computed for each participant for occipital excitation and lateral excitation. (c) SE/KE ratio on a linear scale and (d) SE/KE ratio on a log–log scale. Dashed lines show predicted SE/KE with best-fit model parameters: bLat=0.295, bOcc=0.309, and m=1.08. In all panels, values are mean for 16 participants and error bars indicate plus or minus one standard deviation.