. 2023 Aug 8;145(11):111005. doi: 10.1115/1.4062937

Fig. 8.

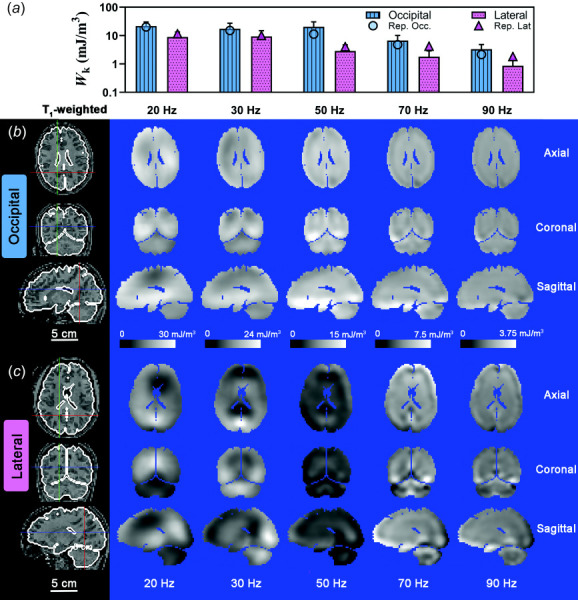
(a) Mean kinetic energy density, Wk, for each frequency and excitation direction. Error bars represent one standard deviation. A log scale is used in (a) for clarity. Symbols represent the mean Wk  for the participant data shown in (b) and (c). Spatial distribution of Wk for representative participants due to (B) occipital excitation and (c) lateral excitation shown on three orthogonal slice planes. Note that the color scale decreases from 30 mJ/m3 at 20 Hz to 3.75 mJ/m3 at 90 Hz. Scale bar applies to all images. Locations of axial slice, coronal slice and sagittal slice are denoted by blue, red, and green line, respectively, in the corresponding T1-weighted images. Participant IDs are U01_WUSTL_0015_01 (b) and U01_WUSTL_0014_01 (c).

(a) Mean kinetic energy density, Wk, for each frequency and excitation direction. Error bars represent one standard deviation. A log scale is used in (a) for clarity. Symbols represent the mean Wk for the participant data shown in (b) and (c). Spatial distribution of Wk for representative participants due to (B) occipital excitation and (c) lateral excitation shown on three orthogonal slice planes. Note that the color scale decreases from 30 mJ/m3 at 20 Hz to 3.75 mJ/m3 at 90 Hz. Scale bar applies to all images. Locations of axial slice, coronal slice and sagittal slice are denoted by blue, red, and green line, respectively, in the corresponding T1-weighted images. Participant IDs are U01_WUSTL_0015_01 (b) and U01_WUSTL_0014_01 (c).